
vue中使用echarts画饼状图
2023-09-11 14:19:39 时间
echarts的中文文档地址:https://echarts.baidu.com/tutorial.html#5%20%E5%88%86%E9%92%9F%E4%B8%8A%E6%89%8B%20ECharts
新文档地址:https://echarts.apache.org/zh/tutorial.html#5%20%E5%88%86%E9%92%9F%E4%B8%8A%E6%89%8B%20ECharts
另一个库:http://antv-2018.alipay.com/zh-cn/g2/3.x/demo/other/word-cloud.html
新地址:
ECharts 正在 Apache 开源基金会孵化中,因此域名已不再使用,请访问 echarts.apache.org
ECharts is now under incubation at the Apache Software Foundation. So this domain name is no longer in use. Visit echarts.apache.org please
采用按需引入的方式
安装echarts包就不说了,上一篇有代码
今天来看看如何画饼状图
<template>
<div>
<div class="pie">
<div id="pie1">
<!-- 为 ECharts 准备一个具备大小(宽高)的 DOM -->
<div id="main1" style="float:left;width:100%;height: 300px"></div>
</div>
<div id="pie2">
<div id="main2" style="float:left;width:100%;height: 300px"></div>
</div>
</div>
</div>
</template>
<script>// 引入基本模板
let echarts = require('echarts/lib/echarts')
// 引入饼状图组件
require('echarts/lib/chart/pie')
// 引入提示框和title组件
require('echarts/lib/component/tooltip')
require('echarts/lib/component/title')
export default {
created(){
},
mounted(){
this.initData();
},
methods:{
//初始化数据
initData() {
// 基于准备好的dom,初始化echarts实例
var myChart = echarts.init(document.getElementById('main1'));
// 绘制图表
myChart.setOption({
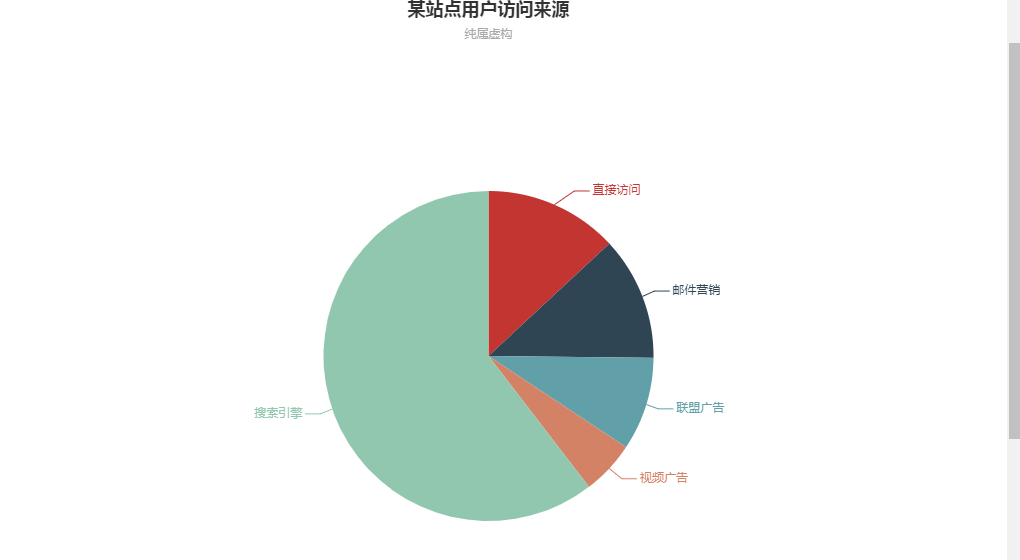
title : {
text: '某站点用户访问来源',//主标题
subtext: '纯属虚构',//副标题
x:'center',//x轴方向对齐方式
},
tooltip : {
trigger: 'item',
formatter: "{a} <br/>{b} : {c} ({d}%)"
},
legend: {
orient: 'vertical',
bottom: 'bottom',
data: ['直接访问','邮件营销','联盟广告','视频广告','搜索引擎']
},
series : [
{
name: '访问来源',
type: 'pie',
radius : '55%',
center: ['50%', '60%'],
data:[
{value:335, name:'直接访问'},
{value:310, name:'邮件营销'},
{value:234, name:'联盟广告'},
{value:135, name:'视频广告'},
{value:1548, name:'搜索引擎'}
],
itemStyle: {
emphasis: {
shadowBlur: 10,
shadowOffsetX: 0,
shadowColor: 'rgba(0, 0, 0, 0.5)'
}
}
}
]
});
},
}
}
</script>
效果图
具体设置请参考 官网
改变折线图的颜色以及折点颜色:
series: [
                  {
                    name: 折线图名称,
                    type: 'line',
                    data: [...],
                    smooth: true,
                    itemStyle : { normal : { lineStyle:{ color:'#324ED9'},color:'#324ED9'},},
                  },
                  {
                    name: 折线图名称,
                    type: 'line',
                    data: [...],
                    smooth: true,
                    itemStyle : { normal : { lineStyle:{ color:'#2BB02D'},color:'#2BB02D'},},
                  }
]
改变工具栏样式:
// 右上角工具栏
     toolbox: {
                  emphasis:{
                    iconStyle:{
                      borderColor:"#486eff",//自定义鼠标悬浮工具栏图标的颜色
                    }
                  },
                  feature: {
                    magicType: {
                      type: ['line', 'bar'],
                      icon:{
                        line:"path://xxx",//自定义折现图标
                        bar:"path://xxx",//自定义柱状图图标
                      }
                    },
                    saveAsImage: {
                      show: true,
                      name:'OverviewPic',//导出图片名称
                      icon:"path://xxx",//自定义保存图标icon
                    },
                    myTool1: {//自定义工具栏
                      show: true,
                      title: 自定义工具名称,
                      icon: "path://xxxxx",
                      onclick: function (){
                        //dosome...
                      }
                    },
                  },
                  tooltip: {}
    },
相关文章
- Vue笔记:vue项目引入bootstrap、elementUI、echarts
- Vue_(Router路由)-vue-router路由的基本用法
- VUE - vue.runtime.esm.js?6e6d:619 [Vue warn]: Do not use built-in or reserved HTML elements as component i
- Vue.js基础体验(一)
- vue-cli3父子组件传值
- vue-json-excel导出数字字符串转为科学计数法问题和文件格式问题
- [Vue] Get up and running with vue-router
- vue.js3:图片镜像(翻转)并保存(vue@3.2.37)
- Vue自定义组件插入值
- vue-resourse简单使用方法
- [Nuxt] Navigate with nuxt-link and Customize isClient Behavior in Nuxt and Vue.js
- Vue入门教程:node安装vue命令行工具及启动项目
- 一个典型的Vue应用的App.vue
- vue+echarts实现动态绘制图表及异步加载数据的方法
- echarts踩坑:echarts series label formatte 不显示(关于Echarts中formatter实现动态数据的方法)
- 在Vue中使用echarts实例
- npm ERR! Could not resolve dependency:npm ERR! peer vue@“^2.5.17“ from element-ui@2.15.12
- Vue中引入echarts。
- vue中使用分页组件、将从数据库中查询出来的数据分页展示(前后端分离SpringBoot+Vue)
- vue中axios的深入使用
- 171:vue+openlayers 获取两个多边形的交集、差集、并集
- 160:vue+openlayers 地图上添加Echarts柱状图
- 030:vue+openlayers读取WKB数据(示例代码)
- 050:vue+openlayers使用Popup组件显示经纬度坐标(代码示例)
- 在Vue项目中引入 ECharts 3D 路径图 Flights GL(需安装echarts、echarts-gl、jQuery依赖,已踩坑)
- Vue(二)vue 指令及用法举例
- vue-cli和vue有什么区别
- vue实现点击选择多选标签(整理)
- 小白的 Vue + Element-Ui 前端开发框架的构建