
提高.net程序性能和稳定性-CLR Profile
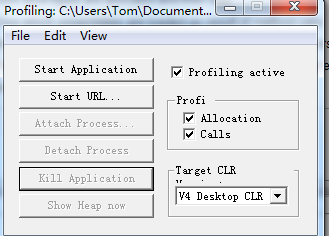
CLR Profile能够看到应用程序的内存堆栈情况并且能够查询垃圾回收机制的行为。利用CLR Profile可以确定你的代码哪儿分配了太多内存,从而导致垃圾回收机制的执行,哪些代码长时间的占有内存。不过CLR Profile不适合在生产环境下使用,因为如果用它,会使你的应用程序的性能下降10倍甚至100倍。
请从http://download.microsoft.com/download/4/4/2/442d67c7-a1c1-4884-9715-803a7b485b82/clr%20profiler.exe下载CLR Profile
CLR Profile 可以做:
- 查看托管堆上的对象
- 查看托管堆中存活的对象
- 谁引用了托管堆上的对象
- 垃圾回收机制在整个应用程序的生命周期内都做了什么
| View | Description |
|---|---|
| Histogram Allocated Types | Gives you a high-level view of what object types are allocated (by allocation size) during the lifetime of your application. This view also shows those objects that are allocated in the large object heap (objects larger than 85 KB).
This view allows you to click parts of the graph so that you can see which methods allocated which objects. |
| Histogram Relocated Types | Displays the objects that the garbage collector has moved because they have survived a garbage collection. |
| Objects By Address | Provides a picture of what is on the managed heap at a given time. |
| Histogram By Age | Allows you to see the lifetime of the objects on the managed heap. |
| Allocation Graph | Graphically displays the call stack for how objects were allocated. You can use this view to:
-See the cost of each allocation by method. -Isolate allocations that you were not expecting. -View possible excessive allocations by a method. |
| Assembly, Module, Function, and Class Graph | These four views are very similar. They allow you to see which methods pulled in which assemblies, functions, modules, or classes. |
| Heap Graph | Shows you all of the objects in the managed heap, along with their connections. |
| Call Graph | Lets you see which methods call which other methods and how frequently.
You can use this graph to get a feel for the cost of library calls and to determine how many calls are made to methods and which methods are called. |
| Time Line | Displays what the garbage collector does over the lifetime of the application. Use this view to:
-Investigate the behavior of the garbage collector. -Determine how many garbage collections occur at the three generations (Generation 0, 1, and 2) and how frequently they occur. -Determine which objects survive garbage collection and are promoted to the next generation. You can select time points or intervals and right-click to show who allocated memory in the interval. |
| Call Tree View | Provides a text-based, chronological, hierarchical view of your application's execution. Use this view to:
-See what types are allocated and their size. -See which assemblies are loaded as result of method calls. -Analyze the use of finalizers, including the number of finalizers executed. -Identify methods where Close or Dispose has not been implemented or called, thereby causing a bottleneck. -Analyze allocations that you were not expecting. |
- using System;
- using System.Collections.Generic;
- using System.Linq;
- using System.Text;
- namespace ConsoleApplication2
- {
- class Program
- {
- static void Main(string[] args)
- {
- string str = "";
- DateTime begin = DateTime.Now;
- for (int i = 0; i < 10000; ++i)
- str += i;
- DateTime end = DateTime.Now;
- Console.WriteLine(begin - end);
- }
- }
- }


- using System;
- using System.Collections.Generic;
- using System.Linq;
- using System.Text;
- using System.Drawing;
- namespace ConsoleApplication2
- {
- class Program
- {
- static void Main(string[] args)
- {
- int start = Environment.TickCount;
- for (int i = 0; i < 100 * 1000; i++)
- {
- Brush b = new SolidBrush(Color.Black); // Brush has a finalizer
- string s = new string(' ', i % 37);
- // Do something with the brush and the string.
- // For example, draw the string with this brush - omitted...
- }
- Console.WriteLine("Program ran for {0} seconds",
- 0.001 * (Environment.TickCount - start));
- }
- }
- }


相关文章
- 学习ASP.NET Core Razor 编程系列五——Asp.Net Core Razor新建模板页面
- 学习ASP.NET Core Razor 编程系列四——Asp.Net Core Razor列表模板页面
- .NET性能优化-使用结构体替代类
- 你真的了解字典(Dictionary)吗? C# Memory Cache 踩坑记录 .net 泛型 结构化CSS设计思维 WinForm POST上传与后台接收 高效实用的.NET开源项目 .net 笔试面试总结(3) .net 笔试面试总结(2) 依赖注入 C# RSA 加密 C#与Java AES 加密解密
- C# -- HttpWebRequest 和 HttpWebResponse 的使用 C#编写扫雷游戏 使用IIS调试ASP.NET网站程序 WCF入门教程 ASP.Net Core开发(踩坑)指南 ASP.Net Core Razor+AdminLTE 小试牛刀 webservice创建、部署和调用 .net接收post请求并把数据转为字典格式
- SQL 横转竖 、竖专横 (转载) 使用Dapper.Contrib 开发.net core程序,兼容多种数据库 C# 读取PDF多级书签 Json.net日期格式化设置 ASPNET 下载共享文件 ASPNET 文件批量下载 递归,循环,尾递归 利用IDisposable接口构建包含非托管资源对象 《.NET 进阶指南》读书笔记2------定义不可改变类型
- 【转】.NET(C#):浅谈程序集清单资源和RESX资源 关于单元测试的思考--Asp.Net Core单元测试最佳实践 封装自己的dapper lambda扩展-设计篇 编写自己的dapper lambda扩展-使用篇 正确理解CAP定理 Quartz.NET的使用(附源码) 整理自己的.net工具库 GC的前世与今生 Visual Studio Package 插件开发之自动生
- bootstrap-data-target触发模态弹出窗元素的data使用 data-toggle与data-target的作用 深入ASP.NET MVC之九:Ajax支持 Asp.Net MVC4系列--进阶篇之AJAX
- Visual Studio 2017中使用正则修改部分内容 如何使用ILAsm与ILDasm修改.Net exe(dll)文件 C#学习-图解教程(1):格式化数字字符串 小程序开发之图片转Base64(C#、.Net) jquery遍历table为每一个单元格取值及赋值 。net加密解密相关方法 .net关于坐标之间一些简单操作
- MVC的验证(模型注解和非侵入式脚本的结合使用) .Net中初探Redis .net通过代码发送邮件 Log4net (Log for .net) 使用GDI技术创建ASP.NET验证码 Razor模板引擎 (RazorEngine) .Net程序员应该掌握的正则表达式
- ADO.NET
- Net is as typeof 运行运算符详解 net 自定义泛型那点事
- .NET实现发送邮件
- ASP.NET比较常用的26个性能优化技巧
- 【TechEmpower】21轮Web框架性能评测,.NET第7Spring第67
- 【小程序】通过request实现小程序与后台asp.net的数据json传输(Post协议 图文+代码)
- ASP.Net刷新页面后自动滚动到原来位置方法汇总
- 如鹏网.NET软件工程师提高班 杨中科.net高级视频
- ASP.NET MVC请求处理管道生命周期的19个关键环节(13-19)
- VS2010自带的性能分析工具分析.NET程序的性能
- SAP MM ME81N PO Value Analysis报表中Net Value 为负数是怎么回事?
- [.NET]c#.net程序中使用ffmpeg.exe来处理视频并生成上传视频的截图
- C#与.NET Framework c#编程语言,和java是一样的。(c#,java) -->javaweb,asp.net