
prometheus监控本地主机及监控远程主机
监控 远程 本地 主机 Prometheus
2023-09-14 09:16:03 时间
文章目录
一、前期准备
1)两台服务器IP
[root@localhost ~]# ifconfig ens32 | awk 'NR==2{print $2}'
192.168.157.166

[root@localhost ~]# ifconfig ens32 | awk 'NR==2{print $2}'
192.168.157.34
2)查看系统版本
[root@localhost ~]# cat /etc/redhat-release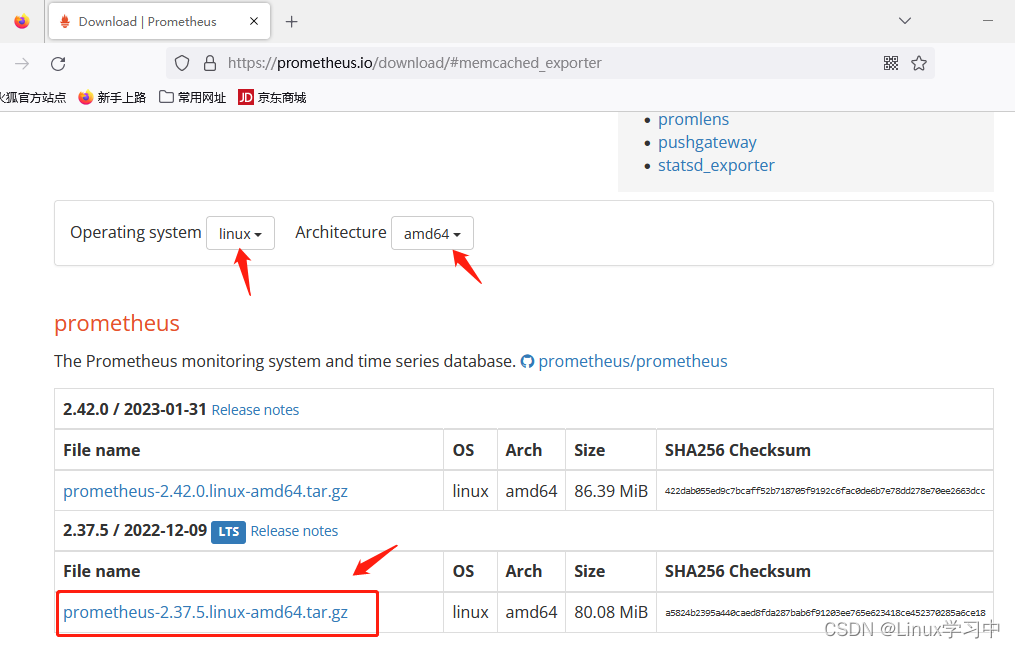
CentOS Linux release 7.9.2009 (Core)3)prometheus程序下载点:Download | Prometheus

二、开始搭建prometheus监控本地主机
这里使用到的IP是:192.168.157.166
1)关闭防火墙,临时关闭SElinux
[root@localhost ~]# iptables -F
[root@localhost ~]# systemctl stop firewalld.service
[root@localhost ~]# setenforce 0
2)上传程序包
使用rz命令上传
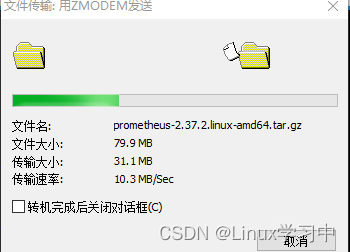
3)解压程序包
[root@localhost ~]# ll prometheus-2.37.2.linux-amd64.tar.gz
-rw-r--r--. 1 root root 83879445 11月  9 19:54 prometheus-2.37.2.linux-amd64.tar.gz
[root@localhost ~]# tar xf prometheus-2.37.2.linux-amd64.tar.gz
[root@localhost ~]# mv prometheus-2.37.2.linux-amd64 prometheus
4)进入prometheus目录中
[root@localhost ~]# cd prometheus/
[root@localhost prometheus]# ll
总用量 206276
drwxr-xr-x. 2 3434 3434        38 11月  4 19:24 console_libraries
drwxr-xr-x. 2 3434 3434       173 11月  4 19:24 consoles
-rw-r--r--. 1 3434 3434     11357 11月  4 19:24 LICENSE
-rw-r--r--. 1 3434 3434      3773 11月  4 19:24 NOTICE
-rwxr-xr-x. 1 3434 3434 109691493 11月  4 19:09 prometheus
-rw-r--r--. 1 3434 3434       934 11月  4 19:24 prometheus.yml
-rwxr-xr-x. 1 3434 3434 101509420 11月  4 19:11 promtool
[root@localhost prometheus]#
5)在后台启动程序
[root@localhost prometheus]# ./prometheus &
[1] 3509
[root@localhost prometheus]# ts=2023-02-11T02:16:56.959Z caller=main.go:491 level=info msg="No time or size retention was set so using the default time retention" duration=15d
ts=2023-02-11T02:16:56.959Z caller=main.go:535 level=info msg="Starting Prometheus Server" mode=server version="(version=2.37.2, branch=HEAD, revision=dd4b6bf1261ae67f5d4f56428f84aa462bfb63c3)"

ts=2023-02-11T02:16:56.971Z caller=manager.go:941 level=info component="rule manager" msg="Starting rule manager..."
6)查看prometheus端口号
[root@localhost ~]# netstat -antup|grep prometheus
tcp6       0      0 :::9090                 :::*                    LISTEN      3509/./prometheus
tcp6       0      0 ::1:41868               ::1:9090                ESTABLISHED 3509/./prometheus
tcp6       0      0 ::1:9090                ::1:41868               ESTABLISHED 3509/./prometheus
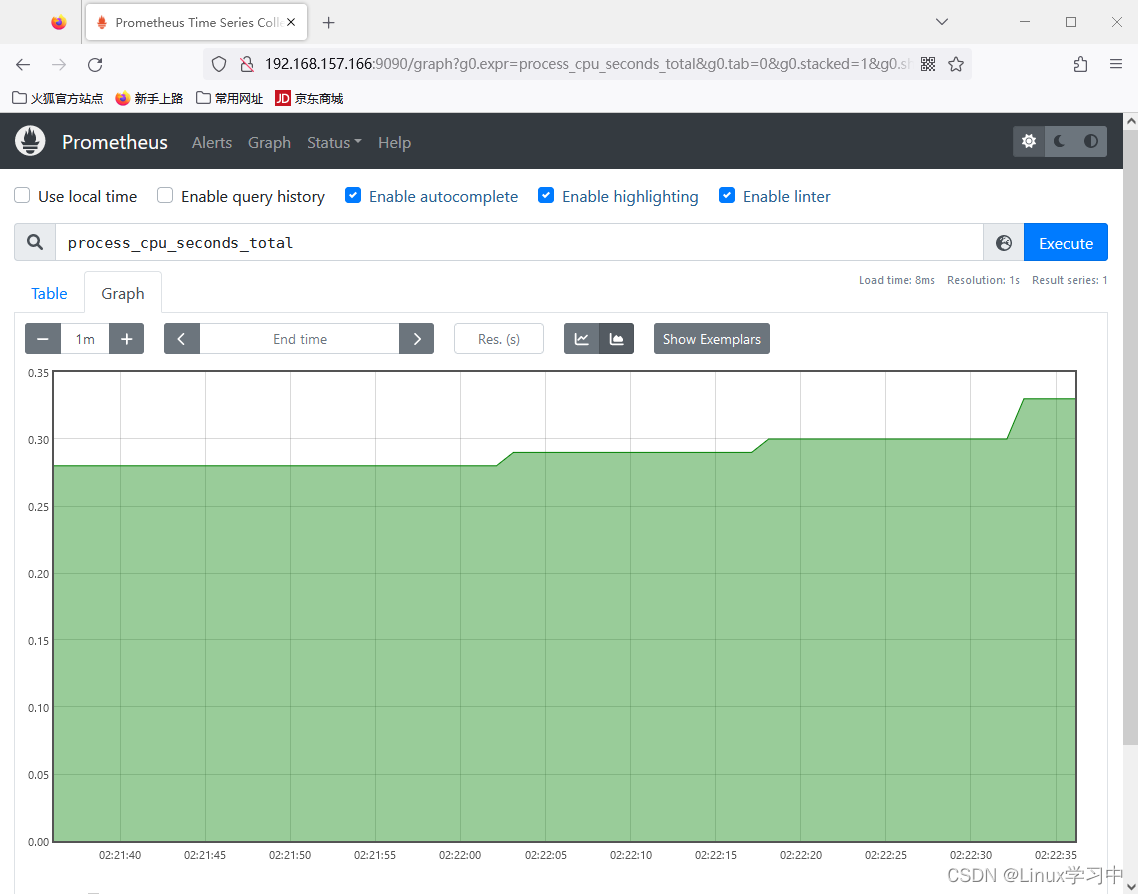
7)使用IP加端口 192.168.157.166:9090
查看本地主机状态
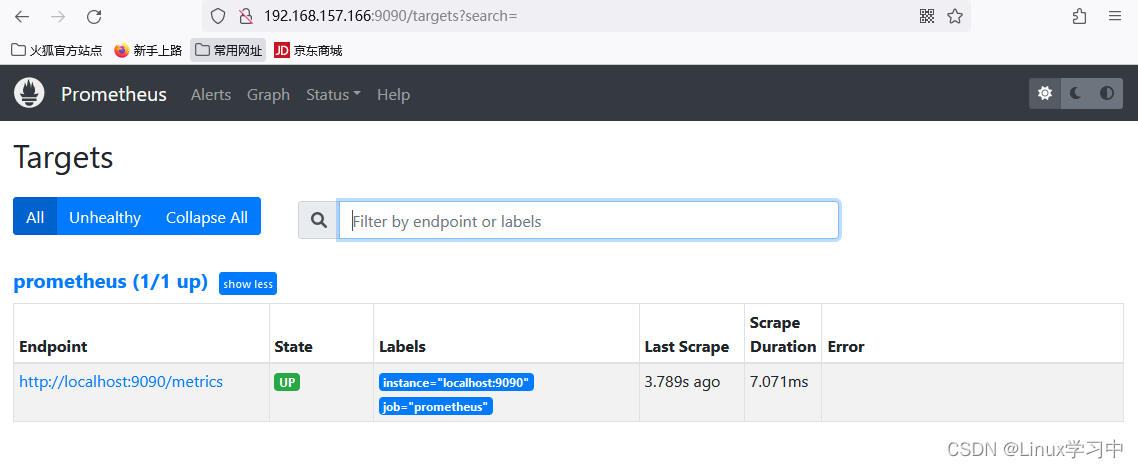
到这里本地主机的监控是已经搭建好了。
三、监控远程主机
这里使用到的IP是:192.168.157.34
1)关闭防火墙
[root@localhost ~]# iptables -F
[root@localhost ~]# systemctl stop firewalld
[root@localhost ~]# setenforce 0
2)上传node_exporter程序包

3)解压并在后台启动
[root@localhost ~]# iptables -F
[root@localhost ~]# systemctl stop firewalld
[root@localhost ~]# setenforce 0
[root@localhost ~]# rz

[root@localhost ~]# tar xf node_exporter-1.4.0.linux-amd64.tar.gz
[root@localhost ~]# mv node_exporter-1.4.0.linux-amd64 node_exporter
[root@localhost ~]# cd node_exporter/
[root@localhost node_exporter]# nohup ./node_exporter &
使用nohup表示不中断运行命令,服务器即使退出终端,也不会影响程序的进行。
4)修改prometheus主配置文件(第一台机器 192.168.157.166)
[root@localhost prometheus]# vim prometheus.yml
[root@localhost prometheus]# tail -n 3 prometheus.yml
  - job_name: "node34"
    static_configs:
      - targets: ["192.168.157.34:9100"]
[root@localhost prometheus]#
5)重启启动prometheus
[root@localhost prometheus]# pkill prometheus
[root@localhost prometheus]# ./prometheus &
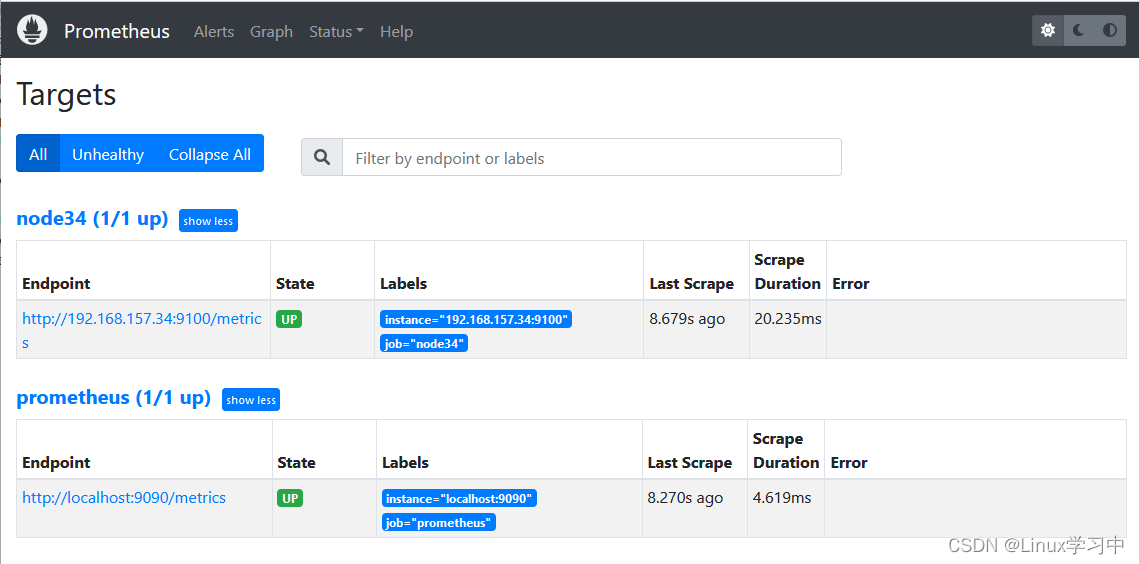
6)查看远程主机的状态也监控上了
相关文章
- 远程视频监控之应用篇(mjpg-streamer)
- 大数据助银行提高征信水平和风险监控能力
- 性能测试:Nginx性能监控与调优
- Shell 脚本监控java进程
- C# 视频监控系列(12):H264播放器——播放录像文件
- Zabbix运维---使用jmx远程监控tomcat
- 通过JMX监控Spring Boot应用
- 【安富莱专题教程第3期】开发板搭建Web服务器,利用花生壳让电脑和手机可以外网远程监控
- 使用Spring开发和监控线程池服务
- jfinal中如何使用过滤器监控Druid监听SQL执行?
- 020-Spring Boot 监控和度量
- Linux系统shell脚本之根分区监控
- Linux系统之温度监控工具——lm_sensors的安装和基本使用
- nagios插件之监控if8接口日志(新接口)
- Python开发学习之Python实现用手机监控远程控制电脑
- 【Zabbix实战之部署篇】docker部署Zabbix+grafana监控平台
- 普罗米修斯监控mysql数据库实战