
prometheus使用missing-container-metrics监控pod
一、简介
Kubernetes 默认情况下使用 cAdvisor 来收集容器的各项指标,足以满足大多数人的需求,但还是有所欠缺,比如缺少对以下几个指标的收集:
-
OOM kill
-
容器重启的次数
-
容器的退出码
missing-container-metrics 这个项目弥补了 cAdvisor 的缺陷,新增了以上几个指标,集群管理员可以利用这些指标迅速定位某些故障。例如,假设某个容器有多个子进程,其中某个子进程被 OOM kill,但容器还在运行,如果不对 OOM kill 进行监控,管理员很难对故障进行定位。
二、安装
官方提供了helm chart方式来进行安装,我们先添加helm仓库
helm repo add missing-container-metrics https://draganm.github.io/missing-container-metrics
把这个chart下载到本地,我们需要修改value.yaml文件
[root@master-01 addons]# helm pull missing-container-metrics/missing-container-metrics
[root@master-01 addons]# ls
blackbox        dingtalk  harbor_exporter                      mysql-exporter    prometheusalert  rules                          servicemonitor  victoriametrics
blackbox-probe  etcd      missing-container-metrics-0.1.1.tgz  process-exporter  redis-exporter   scheduler-controller-svc.yaml  ssl-exporter
[root@master-01 addons]# tar xf  missing-container-metrics-0.1.1.tgz
可配置项
| Parameter | Description | Default |
|---|---|---|
| image.repository | 镜像名称 | dmilhdef/missing-container-metrics |
| image.pullPolicy | 镜像拉取策略 | IfNotPresent |
| image.tag | 镜像tag | v0.21.0 |
| imagePullSecrets | 拉取镜像的secret | [] |
| nameOverride | 覆盖生成的图表名称。默认为 .Chart.Name。 | |
| fullnameOverride | 覆盖生成的版本名称。默认为 .Release.Name。 | |
| podAnnotations | Pod 的Annotations | {"prometheus.io/scrape": "true", "prometheus.io/port": "3001"} |
| podSecurityContext | 为 pod 设置安全上下文 | |
| securityContext | 为 pod 中的容器设置安全上下文 | |
| resources | PU/内存资源请求/限制 | {} |
| useDocker | 从 Docker 获取容器信息,如果容器运行时为docker ,设置为true | false |
| useContainerd | 从 Containerd 获取容器信息,如果容器运行时为containers ,设置为true | true |
我们这里修改missing-container-metrics/values.yaml中``useDocker为true`,然后安装
[root@master-01 addons]# kubectl create namespace missing-container-metrics
namespace/missing-container-metrics created
[root@master-01 addons]# helm install missing-container-metrics  missing-container-metrics -n missing-container-metrics
NAME: missing-container-metrics
LAST DEPLOYED: Tue Jul  6 10:47:35 2021
NAMESPACE: missing-container-metrics
STATUS: deployed
REVISION: 1
TEST SUITE: None
[root@master-01 addons]# helm -n missing-container-metrics list
NAME                            NAMESPACE                       REVISION        UPDATED                                 STATUS          CHART                           APP VERSION
missing-container-metrics       missing-container-metrics       1               2021-07-06 10:47:35.261058822 +0800 CST deployed        missing-container-metrics-0.1.1 0.21.0
##因为我只有一个节点,所以这里daemonset 就只有一个pod
[root@master-01 addons]# kubectl get pod -n missing-container-metrics
NAME                              READY   STATUS    RESTARTS   AGE
missing-container-metrics-s9cgk   1/1     Running   0          115s
我们可以访问服务的3001端口查看metrics,例如
[root@master-01 addons]# curl 100.67.79.150:3001/metrics
# HELP container_last_exit_code Last exit code of the container
# TYPE container_last_exit_code gauge
container_last_exit_code{container_id="docker://0133fb5d739ba98b3985bdc7766fa200334bbbf29de9a61f98a463ec00de53de",container_short_id="0133fb5d739b",docker_container_id="0133fb5d739ba98b3985bdc7766fa200334bbbf29de9a61f98a463ec00de53de",image_id="docker-pullable://k8s.gcr.io/pause:3.2",name="k8s_POD_dns-autoscaler-565bf94d6c-dc6v4_kube-system_96437fe8-200c-4845-a7cc-a27790c6c5a7_0",namespace="kube-system",pod="dns-autoscaler-565bf94d6c-dc6v4"} 0
container_last_exit_code{container_id="docker://0388ba15b0181fead17cfc3606a57aeef0a9b8b73cf3f97eb901565c8aa1702c",container_short_id="0388ba15b018",docker_container_id="0388ba15b0181fead17cfc3606a57aeef0a9b8b73cf3f97eb901565c8aa1702c",image_id="docker-pullable://sha256:e20d2ec0d0ed8ffd693b435af9f2943095a608440e3b845331d6d00344025455",name="k8s_victoriametrics_victoriametrics-0_kube-system_7b381d2c-791b-4e38-8cbb-43485afcb285_0",namespace="kube-system",pod="victoriametrics-0"} 0
container_last_exit_code{container_id="docker://0400f7e29dab47304f97669cb52b5c7c9310fbb5c156c07d0dc9bfca6b8ee14d",container_short_id="0400f7e29dab",docker_container_id="0400f7e29dab47304f97669cb52b5c7c9310fbb5c156c07d0dc9bfca6b8ee14d",image_id="docker-pullable://k8s.gcr.io/pause:3.2",name="k8s_POD_csi-resizer-f6d66495f-s4vkv_longhorn-system_282278da-2638-4e26-8411-802bf57c1ed8_0",namespace="longhorn-system",pod="csi-resizer-f6d66495f-s4vkv"} 0
container_last_exit_code{container_id="docker://04e2c60777ce277c62c7137f1d7b40d9c1523bb3edf9127efd357590f39ba79c",container_short_id="04e2c60777ce",docker_container_id="04e2c60777ce277c62c7137f1d7b40d9c1523bb3edf9127efd357590f39ba79c",image_id="docker-pullable://k8s.gcr.io/pause:3.2",name="k8s_POD_kube-state-metrics-859b6bf99-q8tdf_monitoring_529aa188-f7a0-4b5c-9608-cd8fc473ac8c_2",namespace="monitoring",pod="kube-state-metrics-859b6bf99-q8tdf"} 0
服务公开了如下的指标:
-
container_restarts:容器的重启次数。 -
container_ooms:容器的 OOM 杀死数。这涵盖了容器 cgroup 中任何进程的 OOM 终止。 -
container_last_exit_code:容器的最后退出代码。
每一个指标包含如下标签:
-
docker_container_id:容器的完整 ID。 -
container_short_id:Docker 容器 ID 的前 6 个字节。 -
container_id:容器 id 以与 kubernetes pod 指标相同的格式表示 - 以容器运行时为前缀docker://并containerd://取决于容器运行时。这使得 Prometheus 中的kube_pod_container_info指标可以轻松连接。 -
name:容器的名称。 -
image_id:图像 id 以与 k8s pod 的指标相同的格式表示。这使得 Prometheus 中的kube_pod_container_info指标可以轻松连接。 -
pod:如果io.kubernetes.pod.name在容器上设置了pod标签,则其值将设置为指标中的标签 -
namespace:如果io.kubernetes.pod.namespace容器上设置了namespace标签,则其值将设置为指标的标签。
三、添加PodMonitor 和 PrometheusRule(针对Prometheus Operator)
在template目录下创建文件podmonitor.yaml
{{ if .Values.prometheusOperator.podMonitor.enabled }}
apiVersion: monitoring.coreos.com/v1
kind: PodMonitor
metadata:
  name: {{ include "missing-container-metrics.fullname" . }}
  {{- with .Values.prometheusOperator.podMonitor.namespace }}
  namespace: {{ . }}
  {{- end }}
  labels:
    {{- include "missing-container-metrics.labels" . | nindent 4 }}
    {{- with .Values.prometheusOperator.podMonitor.selector }}
    {{- toYaml . | nindent 4 }}
    {{- end }}
spec:
  selector:
    matchLabels:
      {{- include "missing-container-metrics.selectorLabels" . | nindent 6 }}
  podMetricsEndpoints:
  - port: http
  namespaceSelector:
    matchNames:
      - {{ .Release.Namespace }}
{{ end }}在template目录下创建文件prometheusrule.yaml
{{ if .Values.prometheusOperator.prometheusRule.enabled }}
apiVersion: monitoring.coreos.com/v1
kind: PrometheusRule
metadata:
  name: {{ include "missing-container-metrics.fullname" . }}
  {{- with .Values.prometheusOperator.prometheusRule.namespace }}
  namespace: {{ . }}
  {{- end }}
  labels:
    {{- include "missing-container-metrics.labels" . | nindent 4 }}
    {{- with .Values.prometheusOperator.prometheusRule.selector }}
    {{- toYaml . | nindent 4 }}
    {{- end }}
spec:
  groups:
  - name: {{ include "missing-container-metrics.fullname" . }}
    rules:
      {{- toYaml .Values.prometheusOperator.prometheusRule.rules | nindent 6 }}
{{ end }}修改value.yaml,添加如下
useDocker: true
useContainerd: false
###添加
prometheusOperator:
  podMonitor:
    # Create a Prometheus Operator PodMonitor resource
    enabled: true
    # Namespace defaults to the Release namespace but can be overridden
    namespace: ""
    # Additional labels to add to the PodMonitor so it matches the Operator's podMonitorSelector
    selector:
      app.kubernetes.io/name: missing-container-metrics

  prometheusRule:
    # Create a Prometheus Operator PrometheusRule resource
    enabled: true
    # Namespace defaults to the Release namespace but can be overridden
    namespace: ""
    # Additional labels to add to the PrometheusRule so it matches the Operator's ruleSelector
    selector:
      prometheus: k8s
      role: alert-rules
    # The rules can be set here. An example is defined here but can be overridden.
    rules:
    - alert: ContainerOOMObserved
      annotations:
        message: A process in this Pod has been OOMKilled due to exceeding the Kubernetes memory limit at least twice in the last 15 minutes. Look at the metrics to determine if a memory limit increase is required.
      expr: sum(increase(container_ooms[15m])) by (exported_namespace, exported_pod) > 2
      labels:
        severity: warning
    - alert: ContainerOOMObserved
      annotations:
        message: A process in this Pod has been OOMKilled due to exceeding the Kubernetes memory limit at least ten times in the last 15 minutes. Look at the metrics to determine if a memory limit increase is required.
      expr: sum(increase(container_ooms[15m])) by (exported_namespace, exported_pod) > 10
      labels:
        severity: critical
使用下面命令更新
[root@master-01 addons]# helm upgrade missing-container-metrics -n missing-container-metrics missing-container-metrics/
Release "missing-container-metrics" has been upgraded. Happy Helming!
NAME: missing-container-metrics
LAST DEPLOYED: Tue Jul  6 11:36:02 2021
NAMESPACE: missing-container-metrics
STATUS: deployed
REVISION: 2
TEST SUITE: None
更新后会创建podmonitor和prometeusrules
[root@master-01 addons]# kubectl get prometheusrules.monitoring.coreos.com -n missing-container-metrics
NAME AGE
missing-container-metrics 15s
[root@master-01 addons]# kubectl get podmonitors.monitoring.coreos.com -n missing-container-metrics
NAME AGE
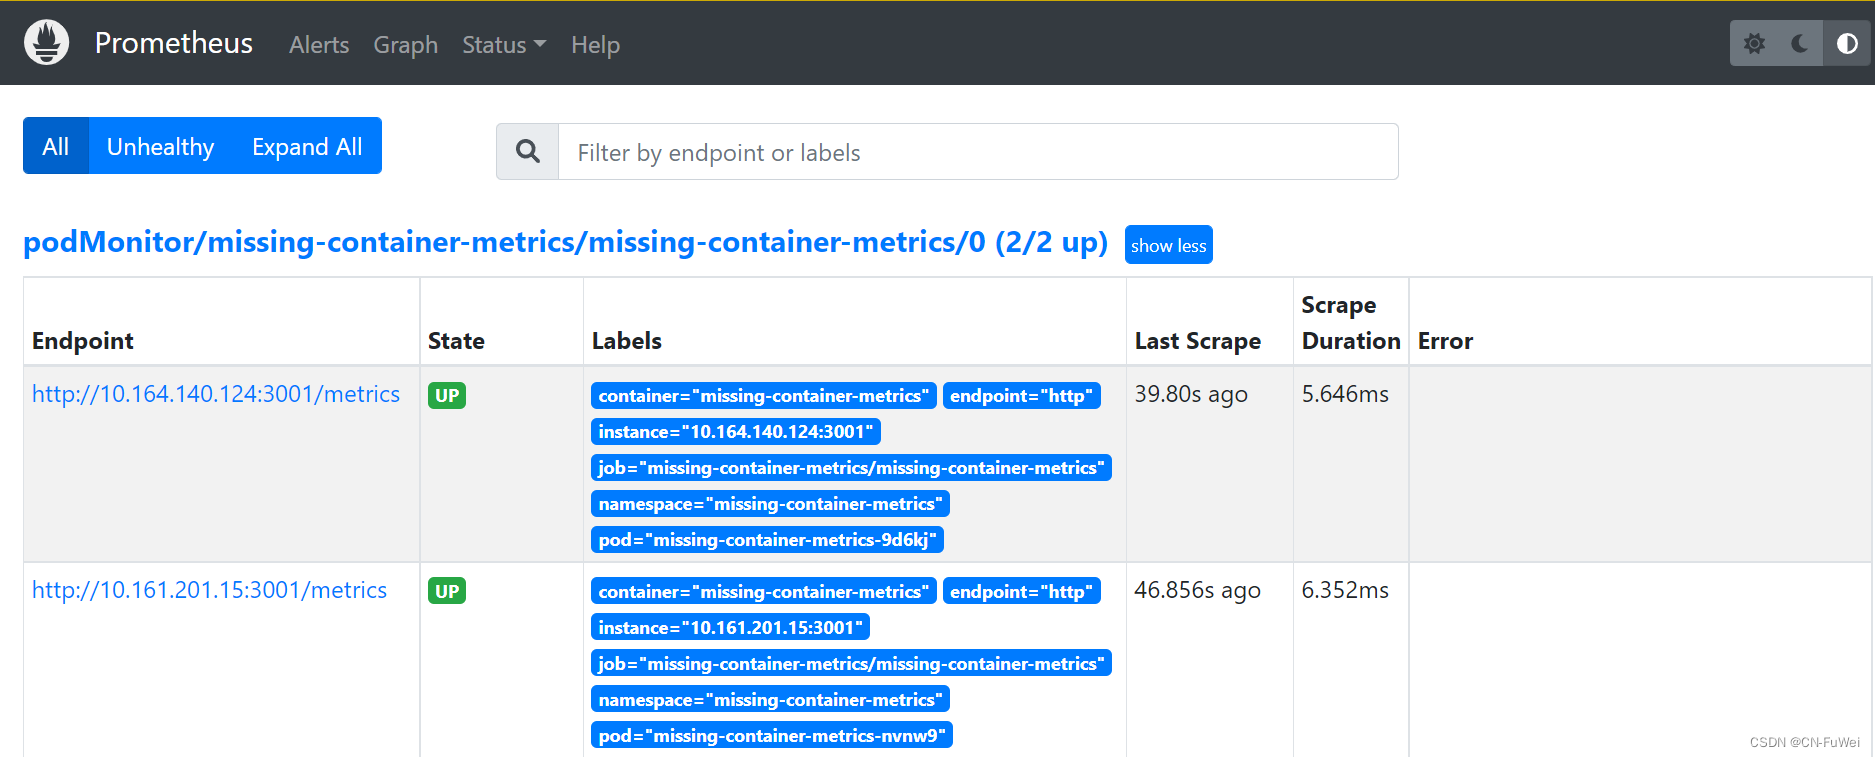
missing-container-metrics 35s我们可以在prometheus ui 上看到相关target和rules
相关文章
- Python pynput监控、控制键盘鼠标
- 统一观测丨如何使用 Prometheus 监控 MySQL
- 统一观测丨如何使用 Prometheus 监控 MySQL
- ASP.NET 性能监控和优化入门
- Zabbix运维---使用jmx远程监控tomcat
- 基于EasyDarwin实现幼儿园监控类项目
- Asp.net(C#) windows 服务{用于实现计划任务,事件监控等}
- centos8平台用ss监控网络
- Prometheus 监控Jenkins
- Prometheus 监控Kubernetes平面组件 coreDNS
- Prometheus 基于k8s服务发现kube-state-metrics监控资源
- Prometheus 基于pod服务发现监控tomcat
- Atitit 运维之道 1.1.devops算是最低门槛了。什么运维平台,搞来搞去也就那些东西。无外乎cmdb、部署、监控之类的,再加点各种小平台自动化需求。 CMDB --Configurati
- 使用 Prometheus 监控 SAP ABAP 应用程序
- Python获取prometheus监控和告警数据
- y86.第四章 Prometheus大厂监控体系及实战 -- prometheus存储(十七)
- y84.第四章 Prometheus大厂监控体系及实战 -- prometheus告警机制进阶(十五)
- y77.第四章 Prometheus大厂监控体系及实战 -- prometheus的服务发现机制(八)
- 云原生|kubernetes |使用Prometheus监控k8s cAdvisor篇(进阶篇--- 一)(centos操作系统)
- 【云原生 | Kubernetes 系列】---Prometheus 监控Haproxy(Haproxy-exporter)
- Prometheus监控
- 老杨说运维 | 直播回顾(一):为什么企业迫切需要统一监控?
- prometheus以监控Pod TCP连接数为例删除一个或多个metrics指标
- prometheus使用node_exporter监控Linux主机CPU、内存、磁盘、服务运行状况(六)
- prometheus监控系统架构原理及组件介绍
- 用 Python 脚本实现对 Linux 服务器的监控
- Prometheus安装部署及简单监控
- 【云原生】prometheus结合jmx exporter 的java agent模式采集tomcat监控实战
- 云原生系列之使用 prometheus监控MySQL实战
- Prometheus GPU 监控