
【云原生 | Kubernetes 系列】---Prometheus 监控Haproxy(Haproxy-exporter)
Kubernetes监控 系列 --- 原生 Prometheus haproxy Exporter
2023-09-14 09:15:20 时间
Prometheus 监控Haproxy(Haproxy-exporter)
1. Haproxy配置
Prometheus 监控Haproxy有2种方式:
- 通过socket文件监控
- 通过状态页url监控
/etc/haproxy/haproxy.cfg
global
log /dev/log local0
log /dev/log local1 notice
chroot /var/lib/haproxy
stats socket /run/haproxy/admin.sock mode 660 level admin expose-fd listeners
stats timeout 30s
user haproxy
group haproxy
daemon
# Default SSL material locations
ca-base /etc/ssl/certs
crt-base /etc/ssl/private
# Default ciphers to use on SSL-enabled listening sockets.
# For more information, see ciphers(1SSL). This list is from:
# https://hynek.me/articles/hardening-your-web-servers-ssl-ciphers/
# An alternative list with additional directives can be obtained from
# https://mozilla.github.io/server-side-tls/ssl-config-generator/?server=haproxy
ssl-default-bind-ciphers ECDH+AESGCM:DH+AESGCM:ECDH+AES256:DH+AES256:ECDH+AES128:DH+AES:RSA+AESGCM:RSA+AES:!aNULL:!MD5:!DSS
ssl-default-bind-options no-sslv3
defaults
log global
mode http
option httplog
option dontlognull
timeout connect 5000
timeout client 50000
timeout server 50000
errorfile 400 /etc/haproxy/errors/400.http
errorfile 403 /etc/haproxy/errors/403.http
errorfile 408 /etc/haproxy/errors/408.http
errorfile 500 /etc/haproxy/errors/500.http
errorfile 502 /etc/haproxy/errors/502.http
errorfile 503 /etc/haproxy/errors/503.http
errorfile 504 /etc/haproxy/errors/504.http
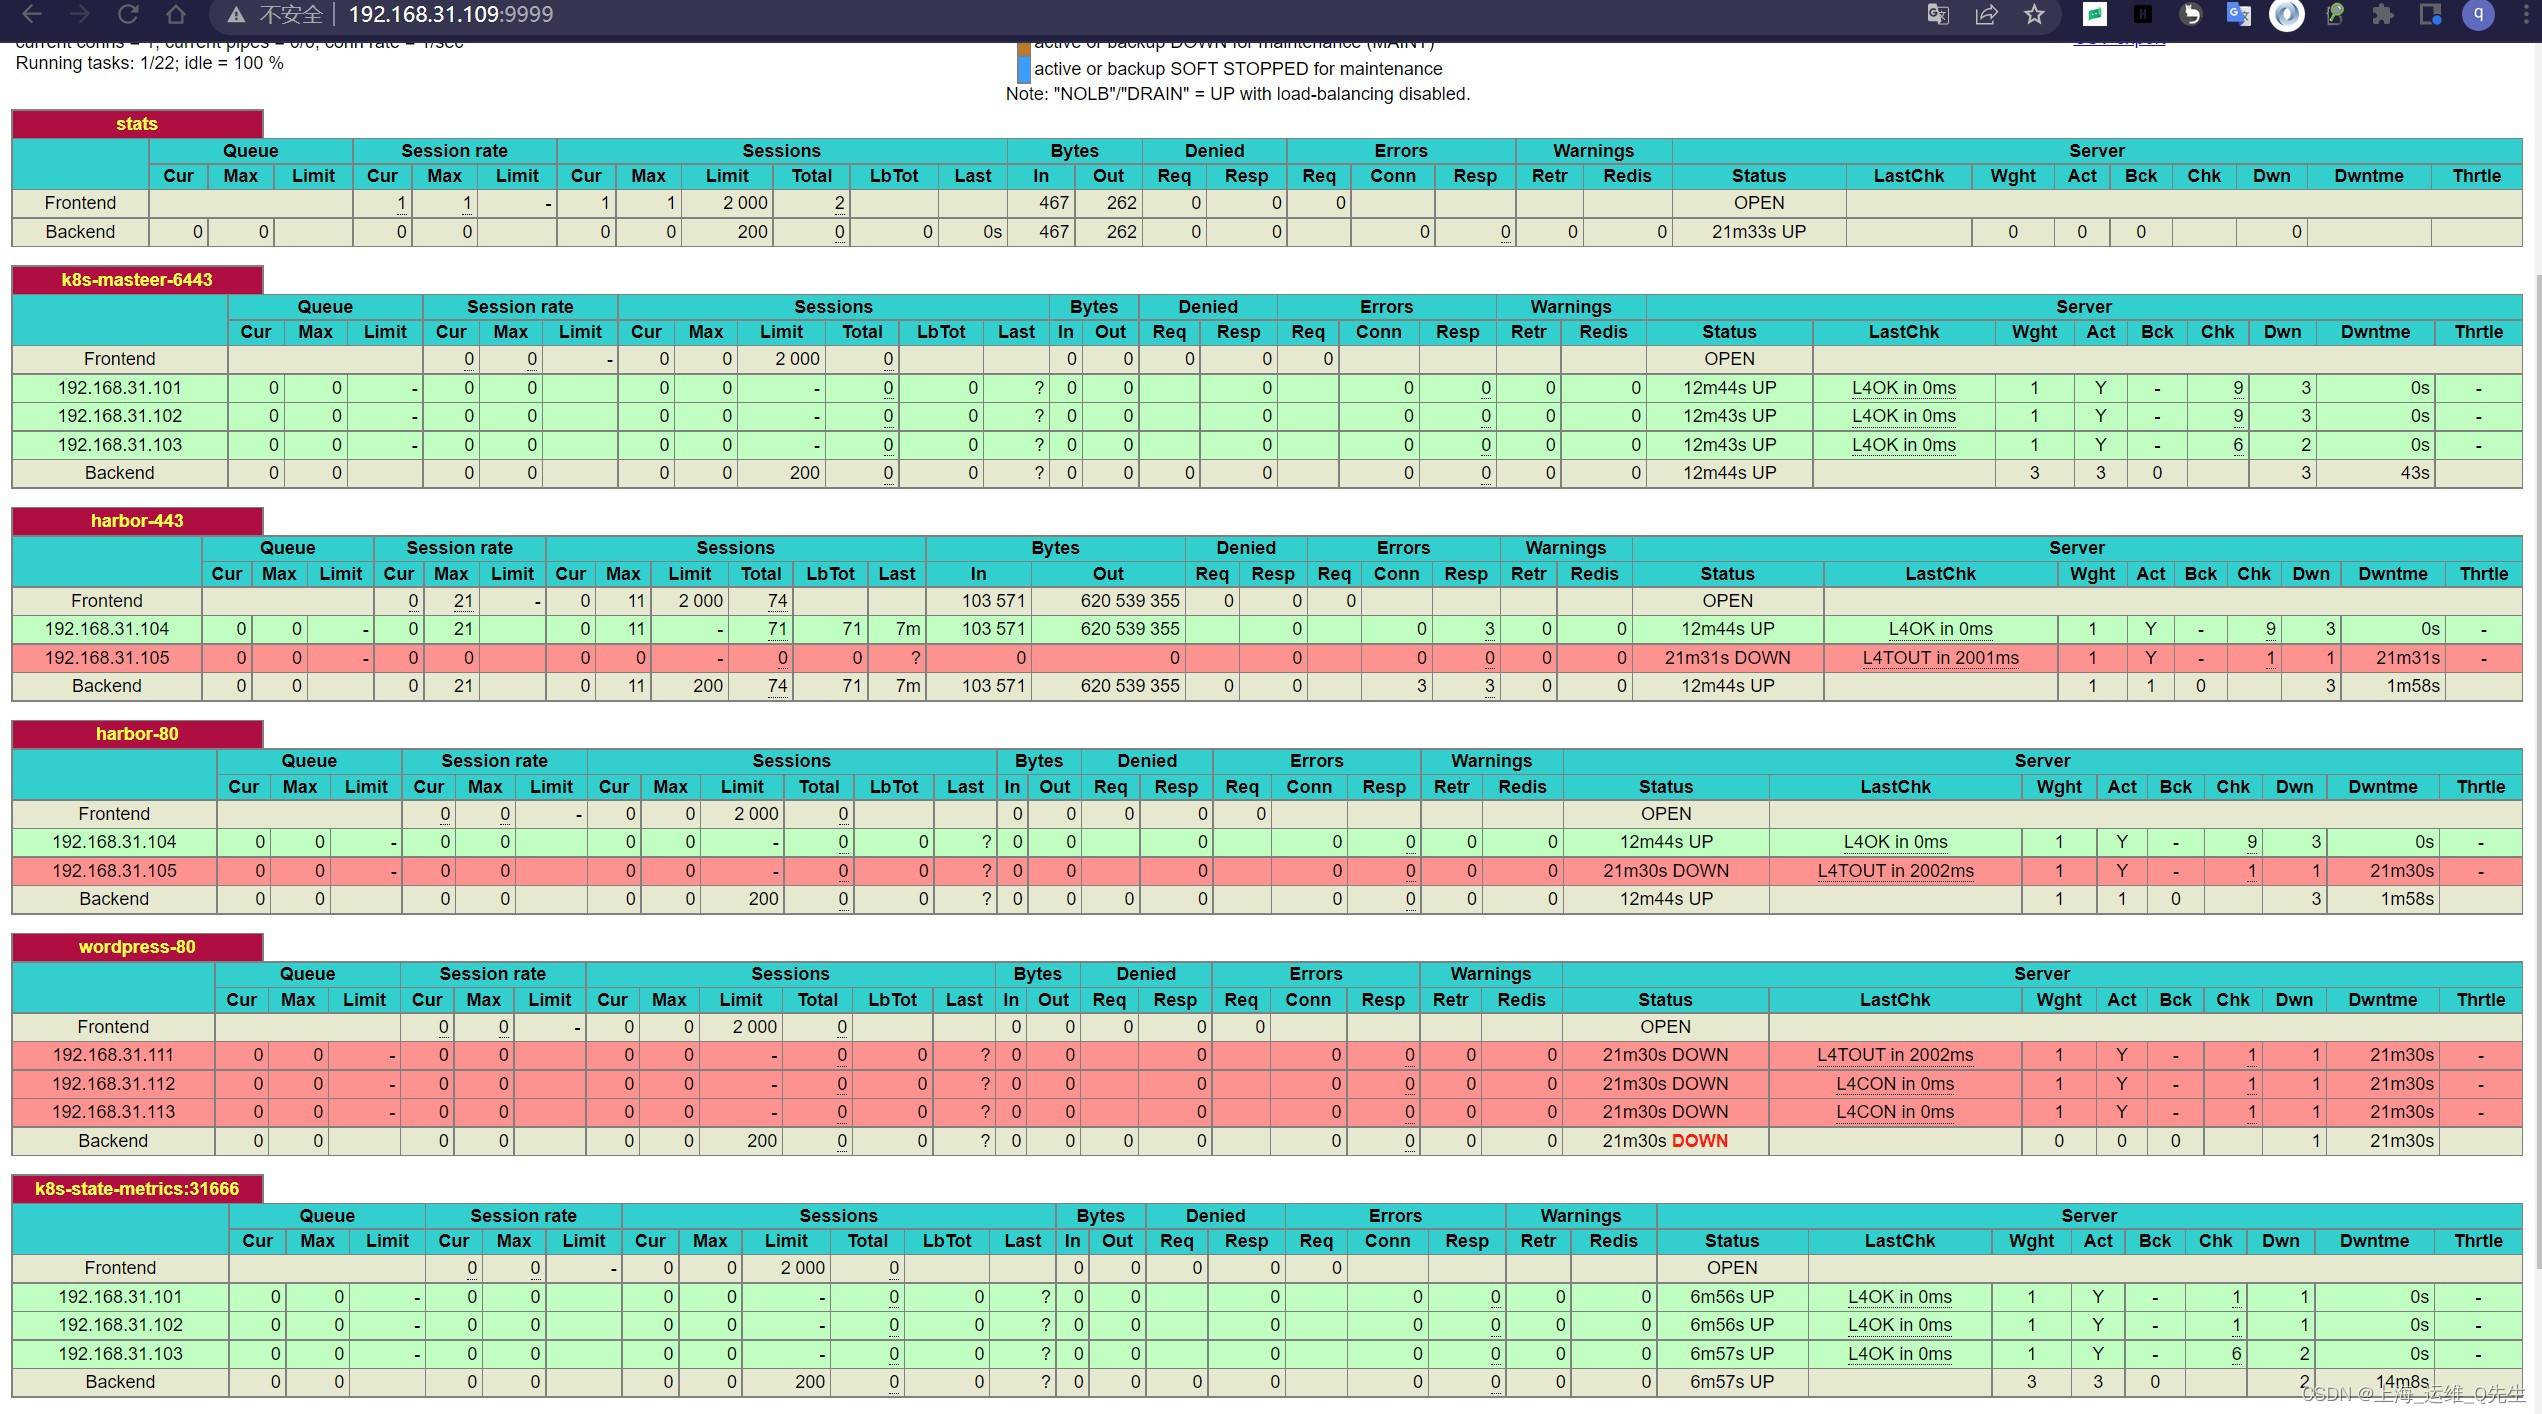
listen stats
mode http
bind 0.0.0.0:9999
stats enable
log global
stats uri /
stats auth admin:root123
listen k8s-masteer-6443
bind 192.168.31.188:6443
mode tcp
server 192.168.31.101 192.168.31.101:6443 check inter 2s fall 3 rise 5
server 192.168.31.102 192.168.31.102:6443 check inter 2s fall 3 rise 5
server 192.168.31.103 192.168.31.103:6443 check inter 2s fall 3 rise 5
listen harbor-443
bind 192.168.31.189:443
mode tcp
server 192.168.31.104 192.168.31.104:443 check inter 2s fall 3 rise 5
server 192.168.31.105 192.168.31.105:443 check inter 2s fall 3 rise 5
listen harbor-80
bind 192.168.31.189:80
mode tcp
balance source
server 192.168.31.104 192.168.31.104:443 check inter 2s fall 3 rise 5
server 192.168.31.105 192.168.31.105:443 check inter 2s fall 3 rise 5
listen wordpress-80
bind 192.168.31.188:80
mode http
server 192.168.31.111 192.168.31.111:30031 check inter 2s fall 3 rise 5
server 192.168.31.112 192.168.31.112:30031 check inter 2s fall 3 rise 5
server 192.168.31.113 192.168.31.113:30031 check inter 2s fall 3 rise 5
listen k8s-state-metrics:31666
bind 192.168.31.188:31666
mode http
server 192.168.31.101 192.168.31.101:31666 check inter 2s fall 3 rise 5
server 192.168.31.102 192.168.31.102:31666 check inter 2s fall 3 rise 5
server 192.168.31.103 192.168.31.103:31666 check inter 2s fall 3 rise 5
2. 安装配置Haproxy-exporter
2.1 下载安装Haproxy-exporter
root@haproxy-1:~# mkdir /apps
root@haproxy-1:~# cd /apps
root@haproxy-1:/apps# wget https://github.com/prometheus/haproxy_exporter/releases/download/v0.13.0/haproxy_exporter-0.13.0.linux-amd64.tar.gz
root@haproxy-1:/apps# tar xf haproxy_exporter-0.13.0.linux-amd64.tar.gz
root@haproxy-1:/apps# ln -sf /apps/haproxy_exporter-0.13.0.linux-amd64/haproxy_exporter /usr/bin/
2.2 编辑service文件
2.2.1 通过socket文件监控
默认端口9101
root@haproxy-1:/apps# vi /etc/systemd/system/haproxy_exporter.service
[Unit]
Description=Prometheus Haproxy_exporter
After=network.target

[Service]
ExecStart=/usr/bin/haproxy_exporter --haproxy.scrape-uri=unix:/run/haproxy/admin.sock

[Install]
WantedBy=multi-user.target
启动服务
root@haproxy-1:/apps# systemctl enable --now haproxy_exporter.service
Created symlink /etc/systemd/system/multi-user.target.wants/haproxy_exporter.service → /etc/systemd/system/haproxy_exporter.service.
root@haproxy-1:/apps# ss -ntlup|grep 9101
tcp   LISTEN   0        20480                    *:9101                 *:*      users:(("haproxy_exporte",pid=2240,fd=3))
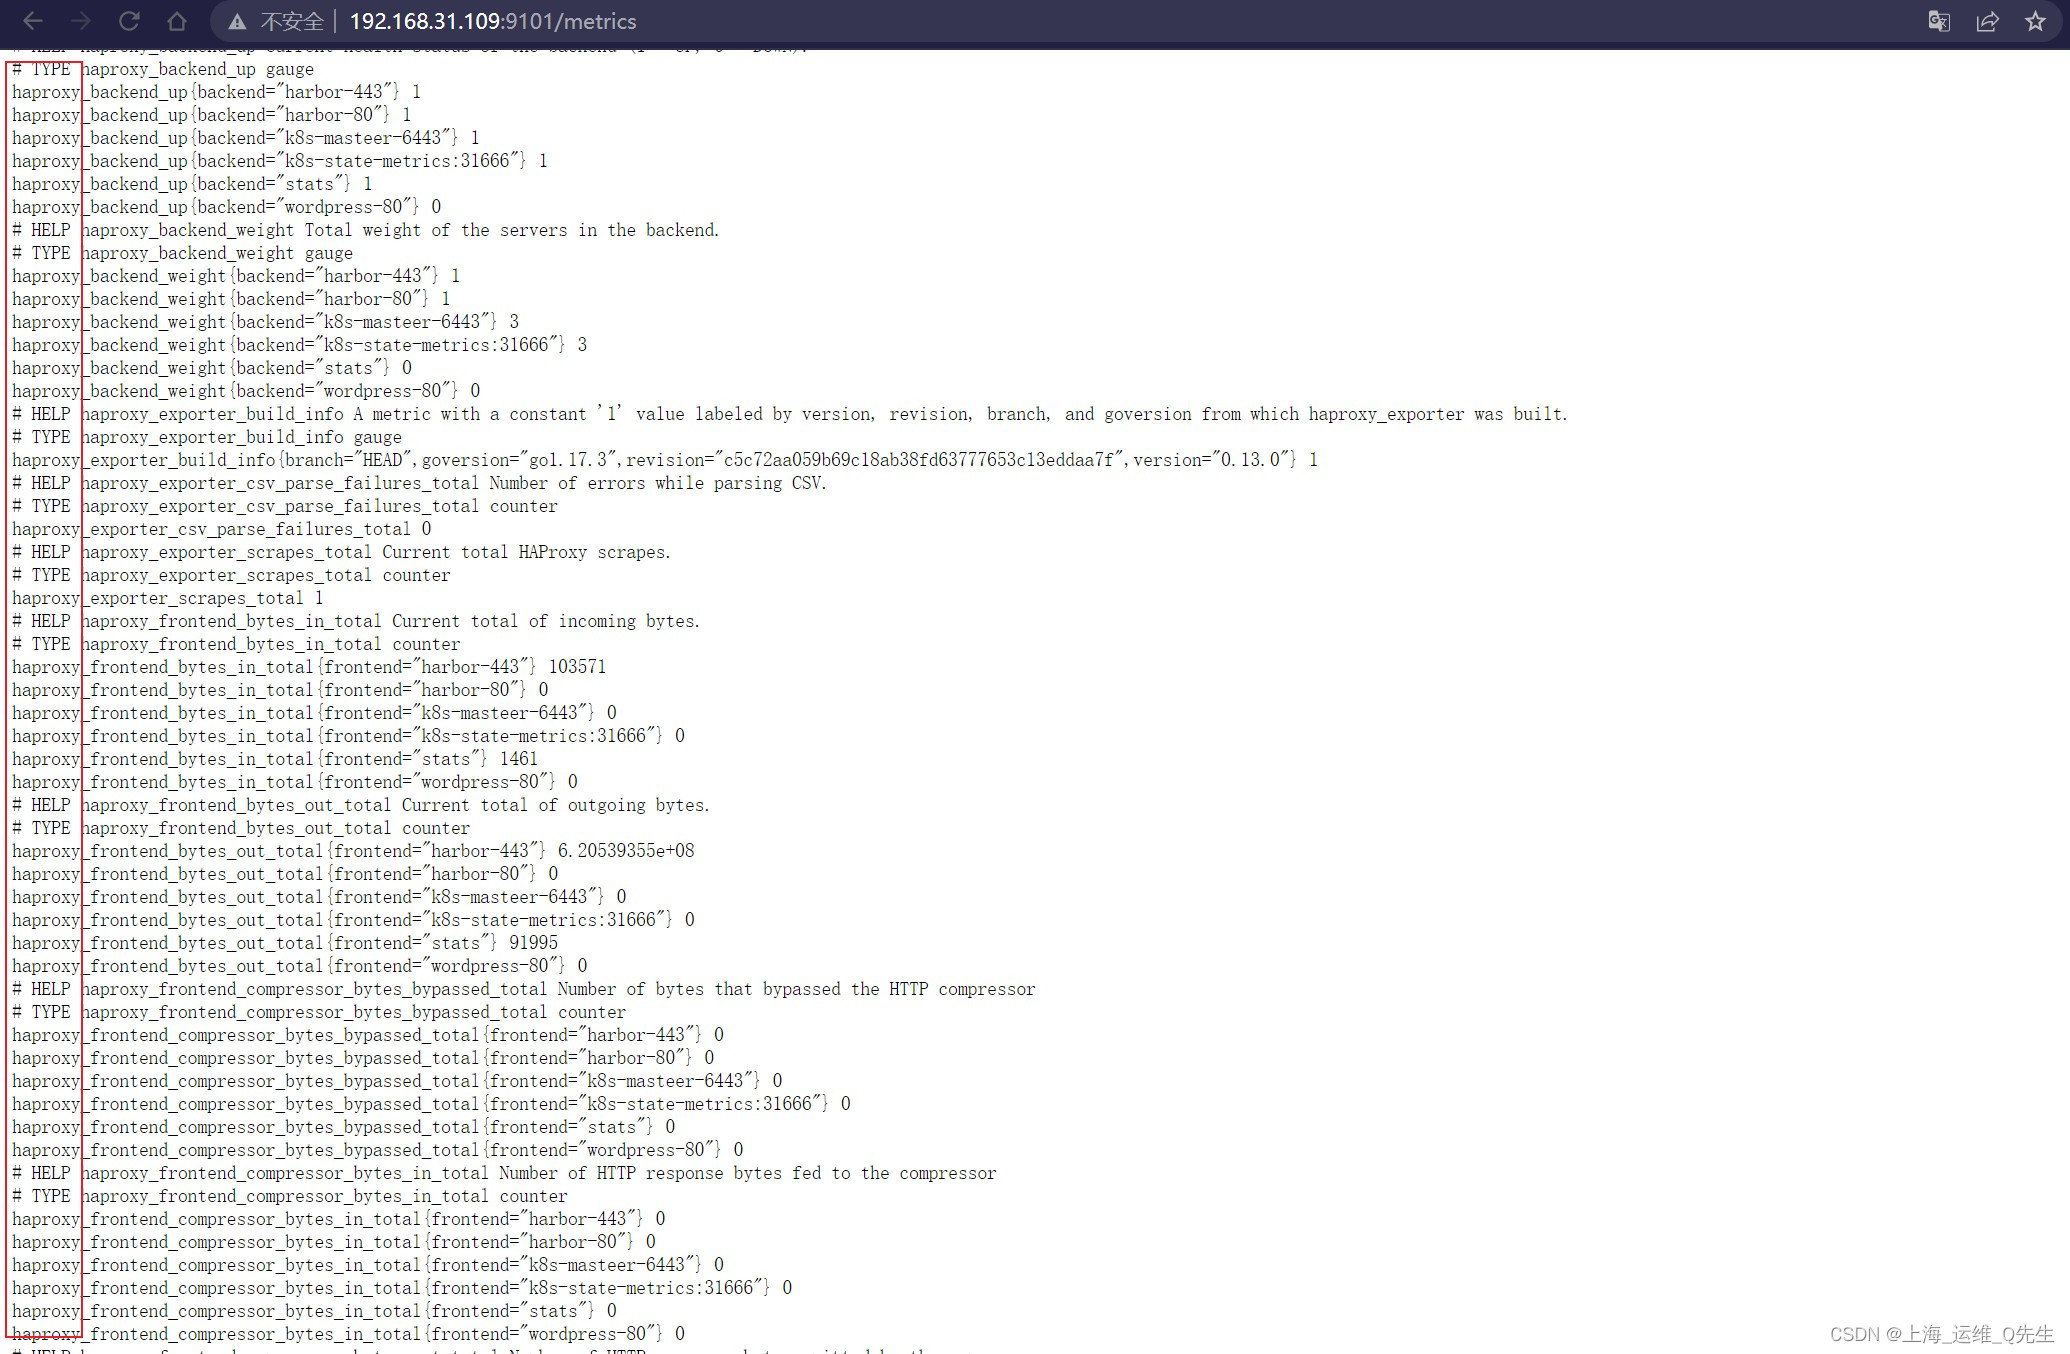
**验证metrics数据:**通过访问 /metrics可以看到获取到haproxy开头的这些参数信息,如果没有这部分键值,需要再次确认service的配置
2.2.2 通过状态页监控
在/etc/haproxy/haproxy.cfg 中确保已经打开了状态页的配置
listen stats
  mode http
  bind 0.0.0.0:9999
  stats enable
  log global
  stats uri /
  stats auth admin:root123
配置文件内容
[Unit]
Description=Prometheus Haproxy_exporter
After=network.target

[Service]
## 通过csv格式解析表格中的数据
ExecStart=/usr/bin/haproxy_exporter --haproxy.scrape-uri="http://admin:root123@192.168.31.109:9999/;csv"
#ExecStart=/usr/bin/haproxy_exporter --haproxy.scrape-uri=unix:/run/haproxy/admin.sock

[Install]
WantedBy=multi-user.target
重启haproxy_exporter服务
root@haproxy-1:/apps# systemctl daemon-reload
root@haproxy-1:/apps# systemctl restart haproxy_exporter.service
**验证metrics数据:**同样通过url确认/metrics可以获得haproxy_开头的这些键值
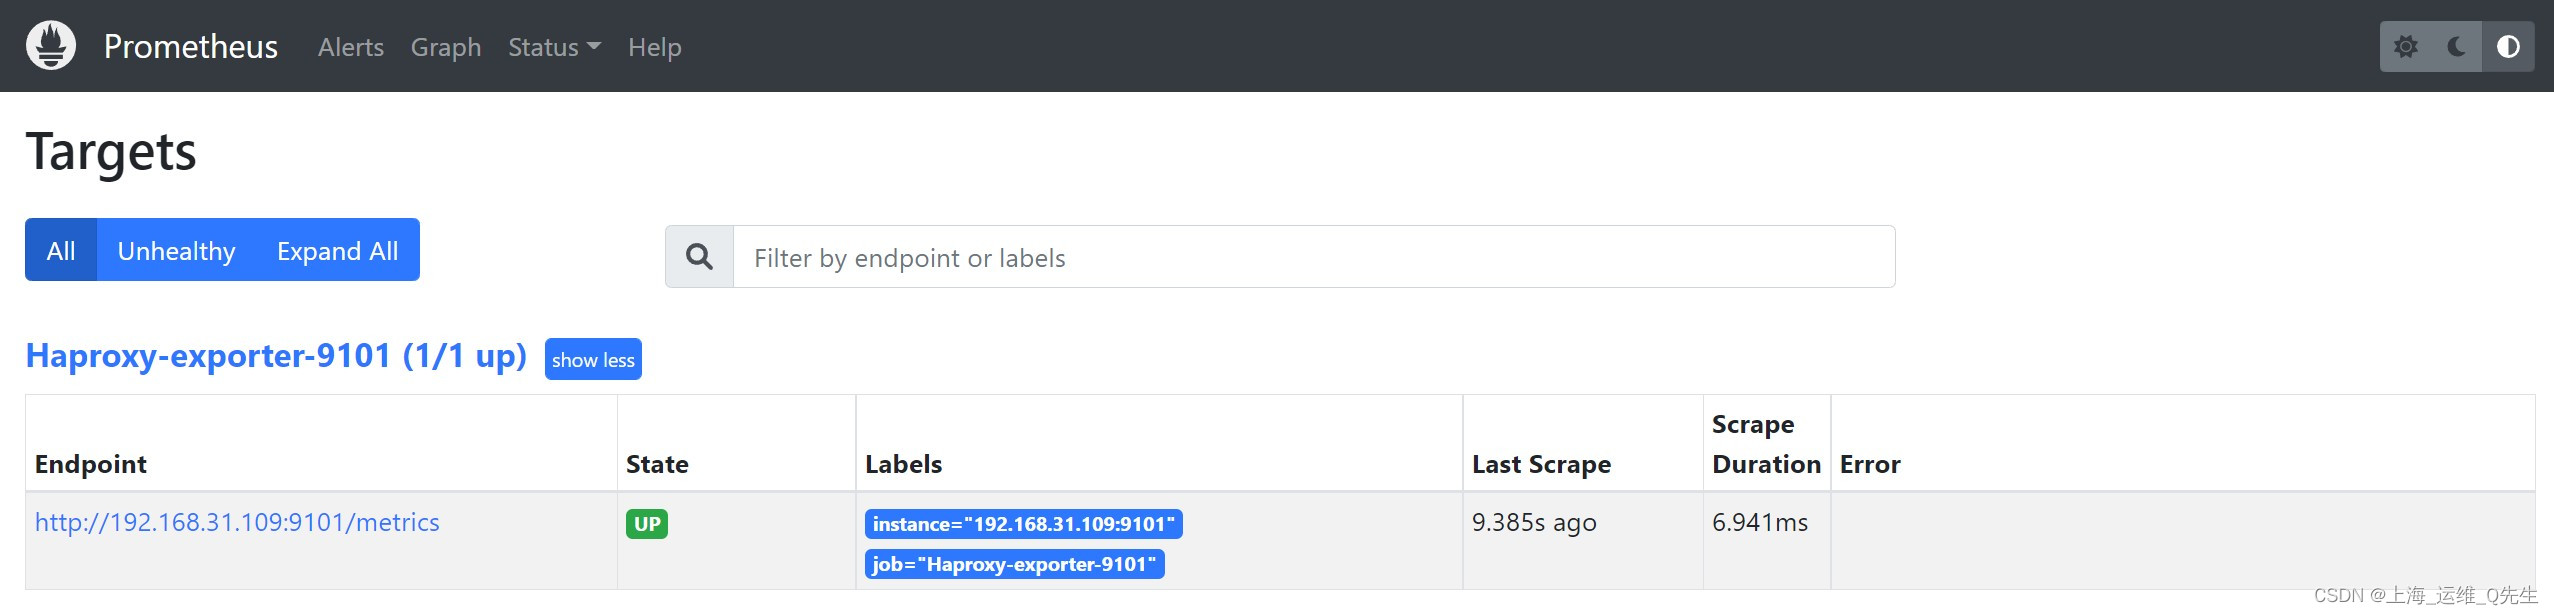
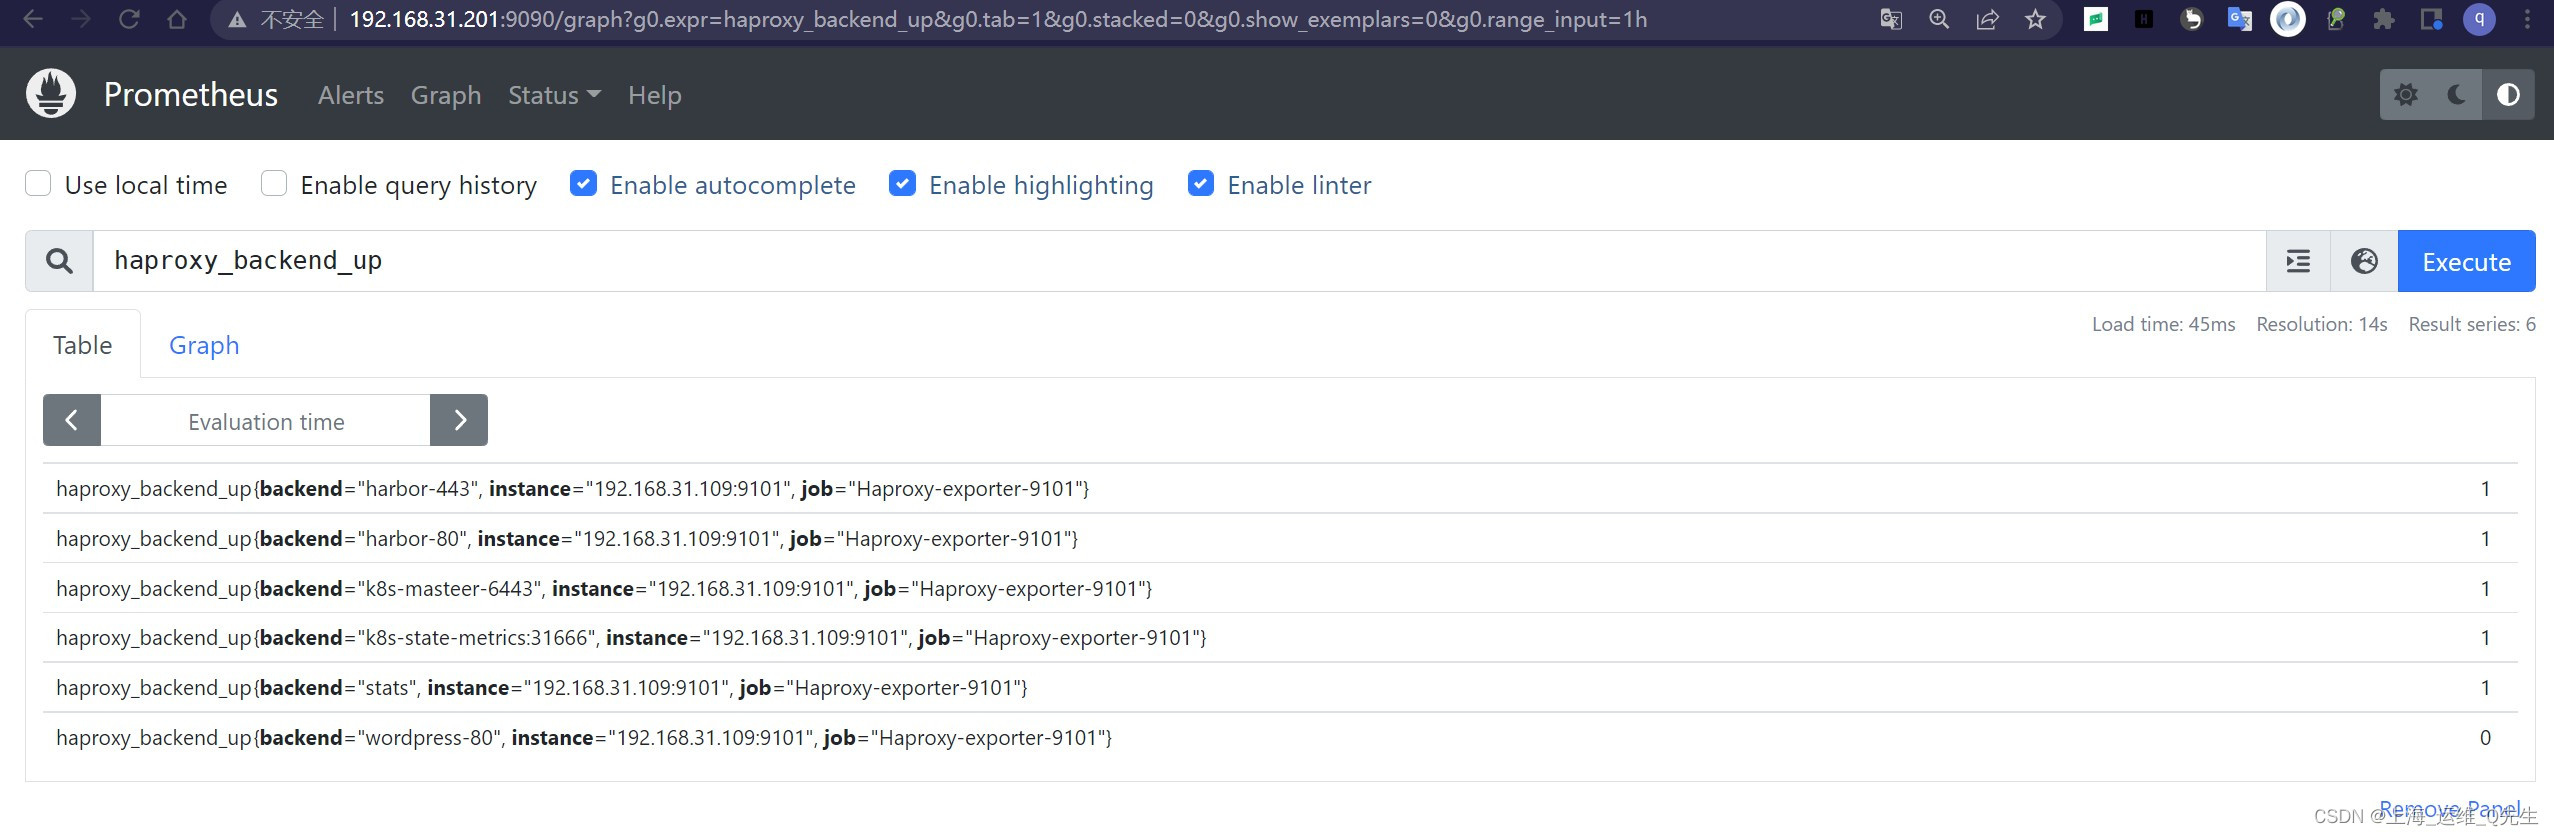
3. Prometheus 抓取监控数据
配置prometheus.yaml,追加haproxy监控内容
  - job_name: "Haproxy-exporter-9101"
    metrics_path: /metrics
    static_configs:
      - targets: ["192.168.31.109:9101"]
重启prometheus后通过网页访问是否可以抓取到监控内容
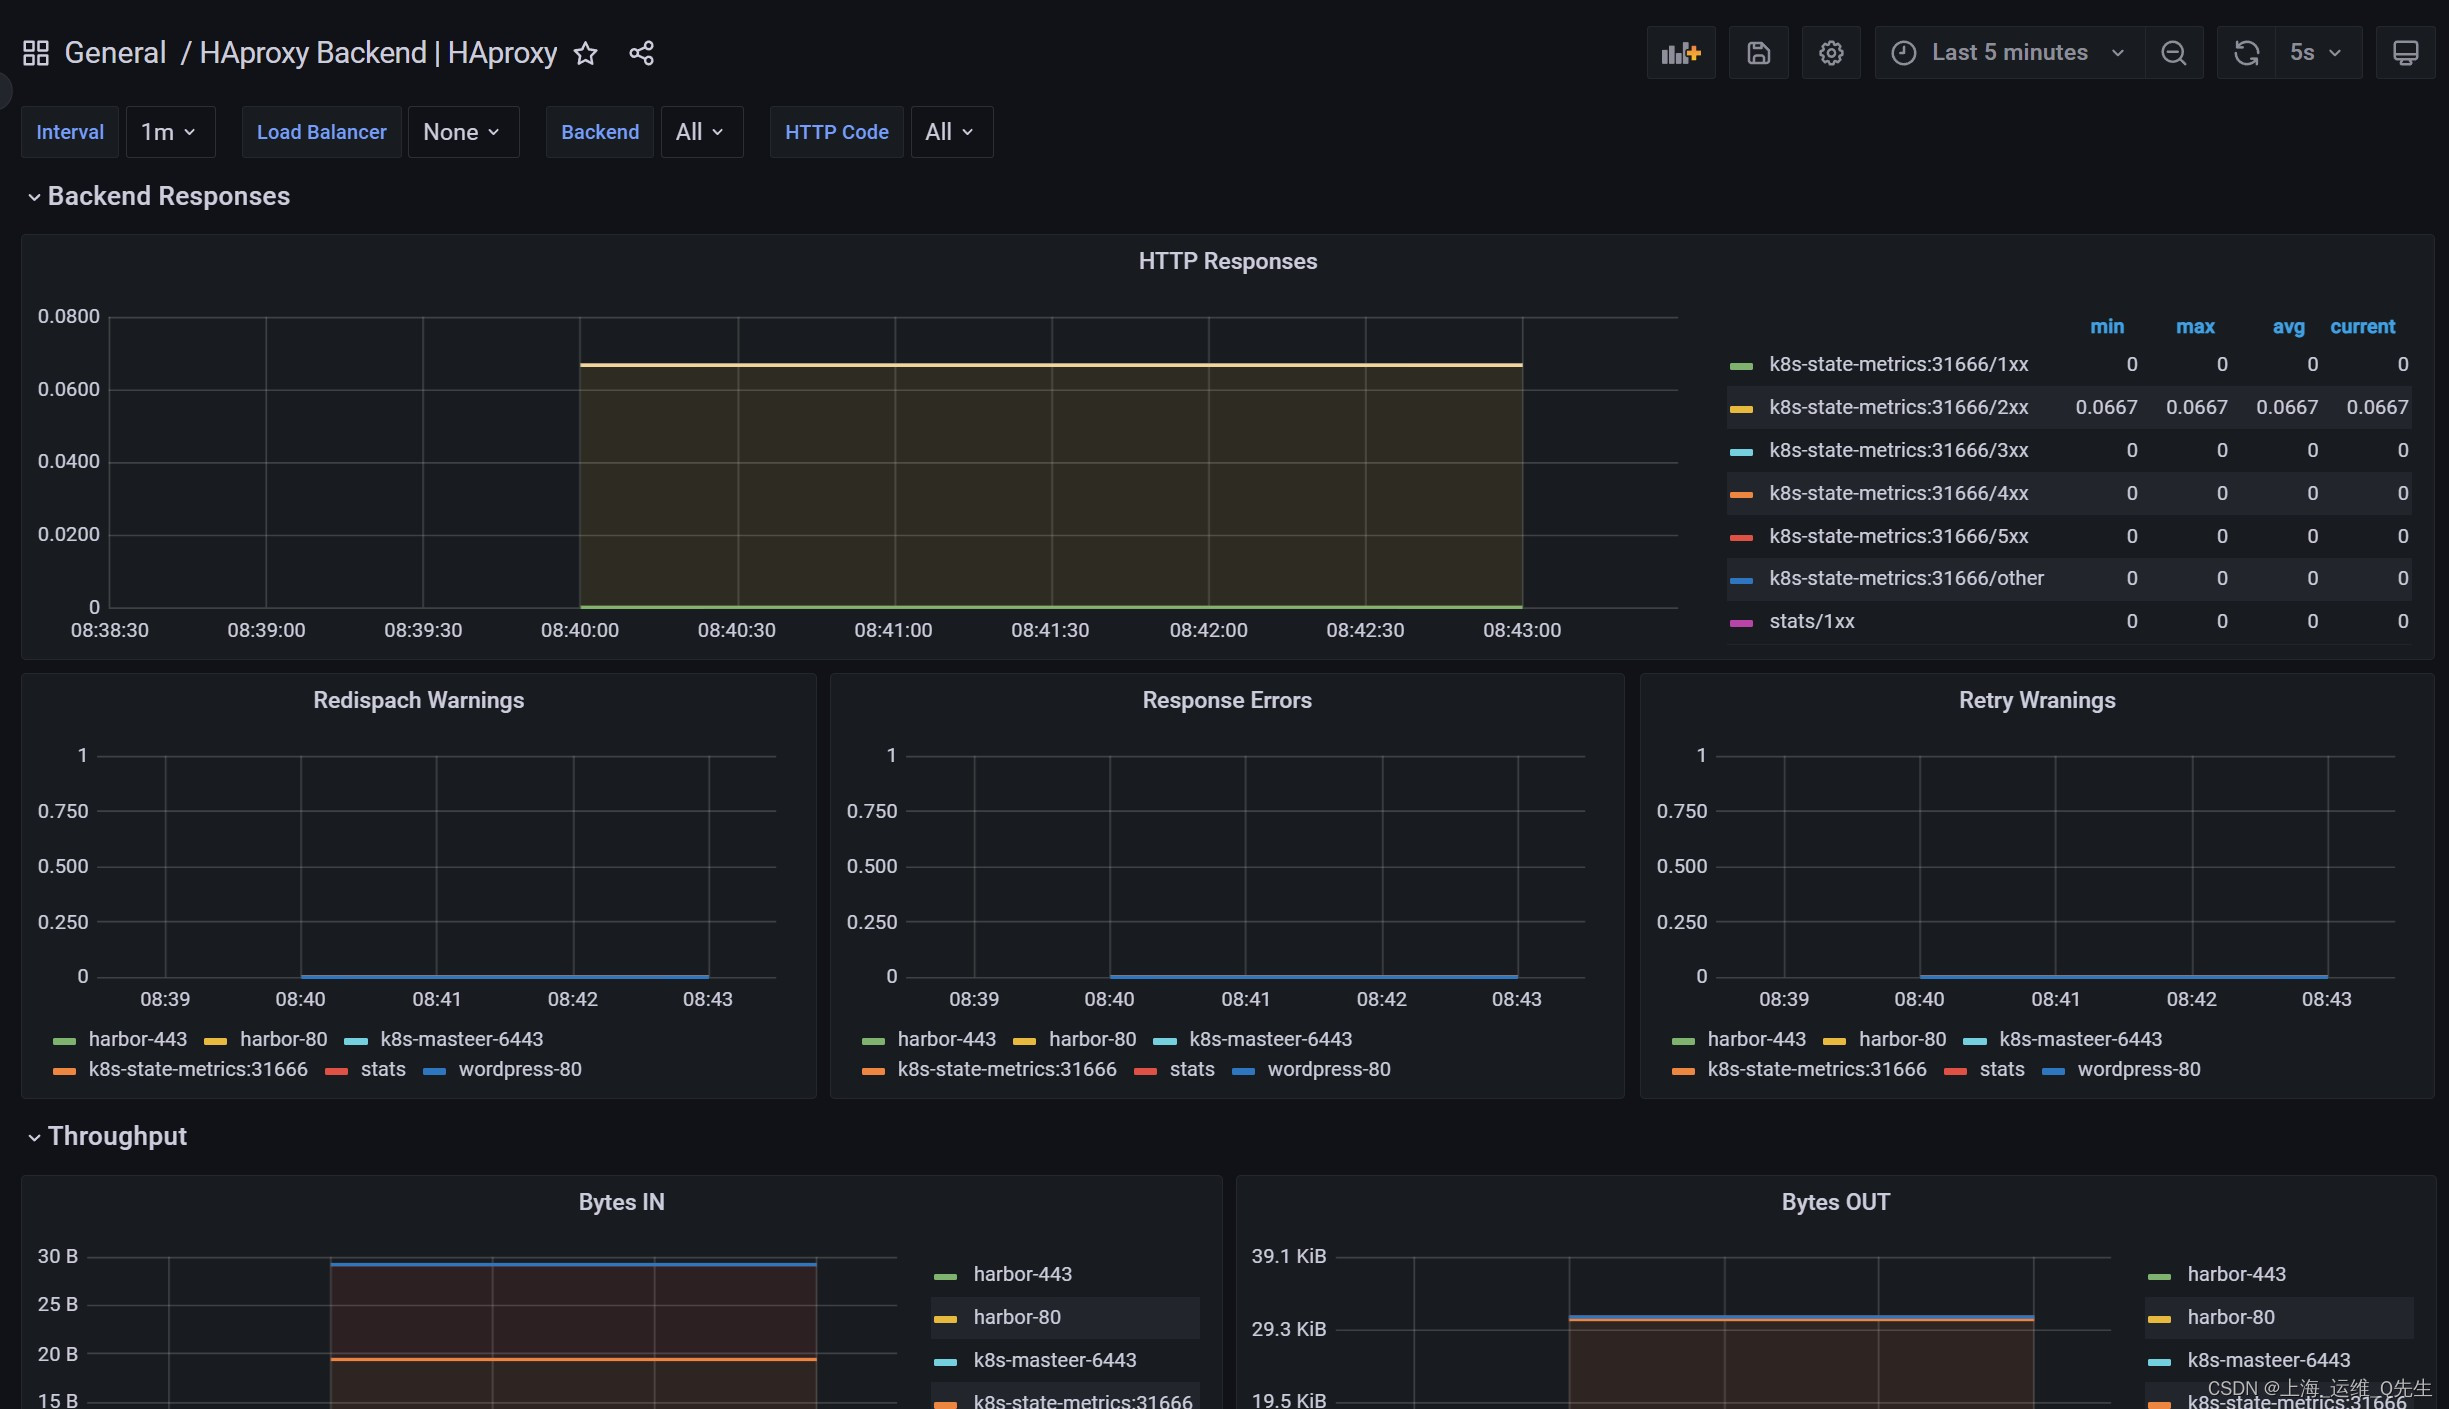
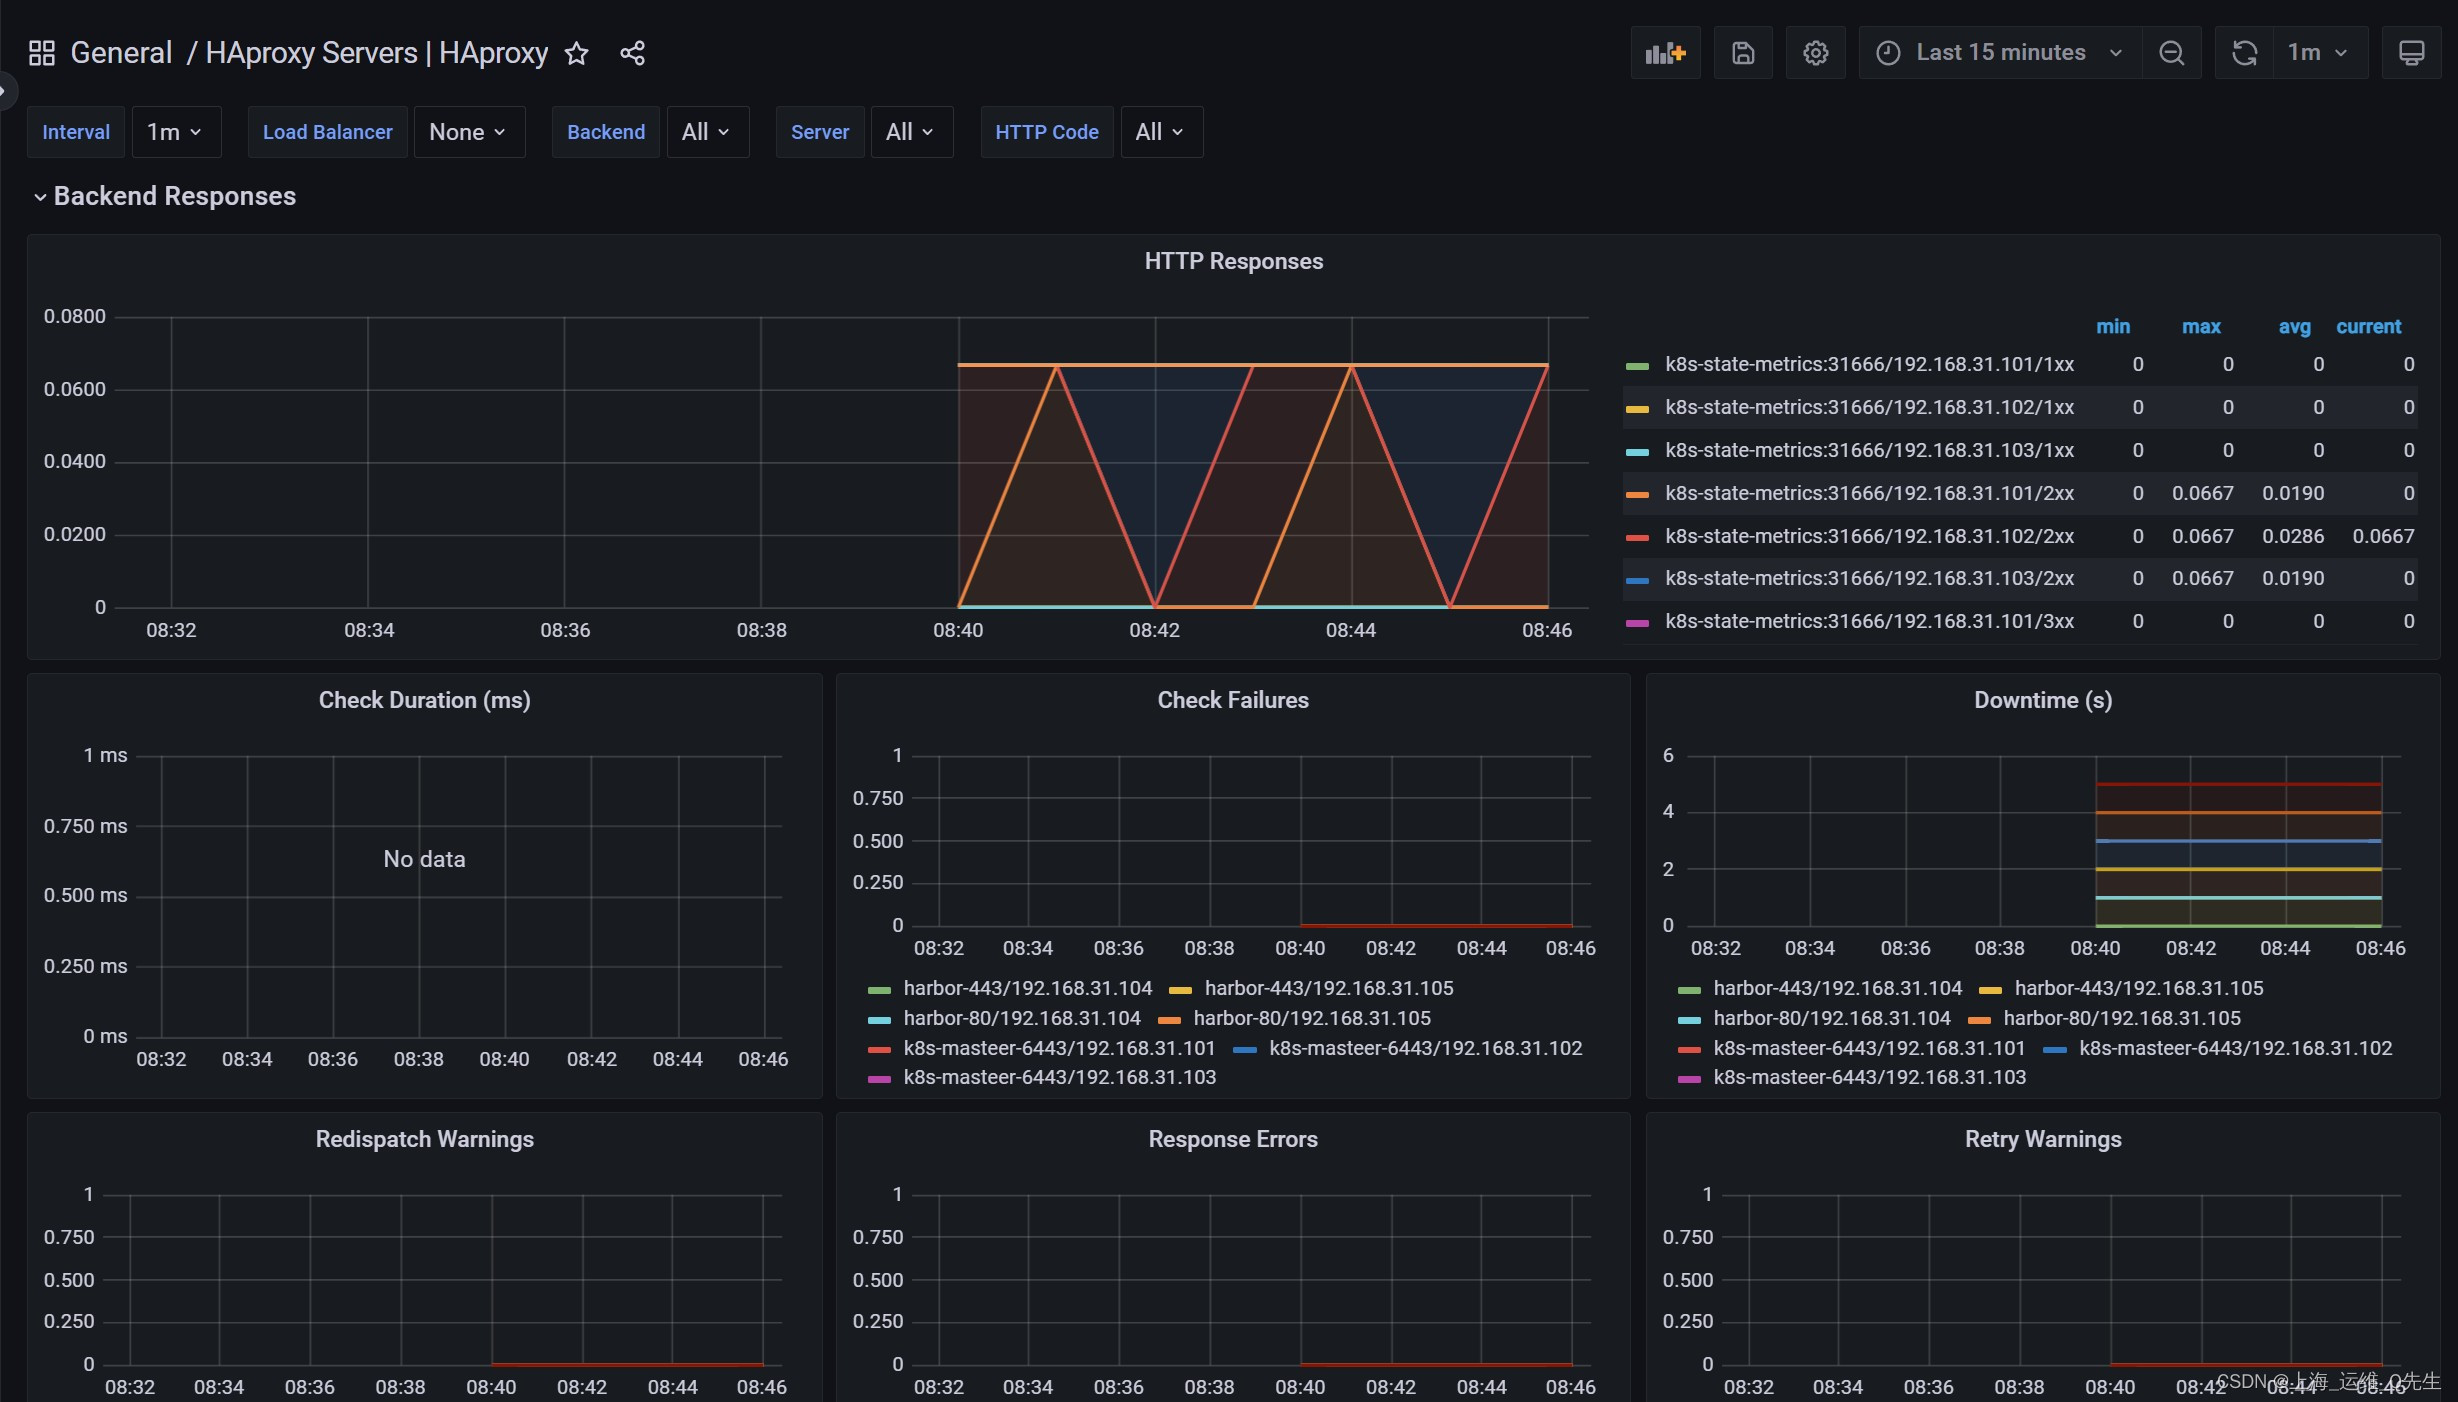
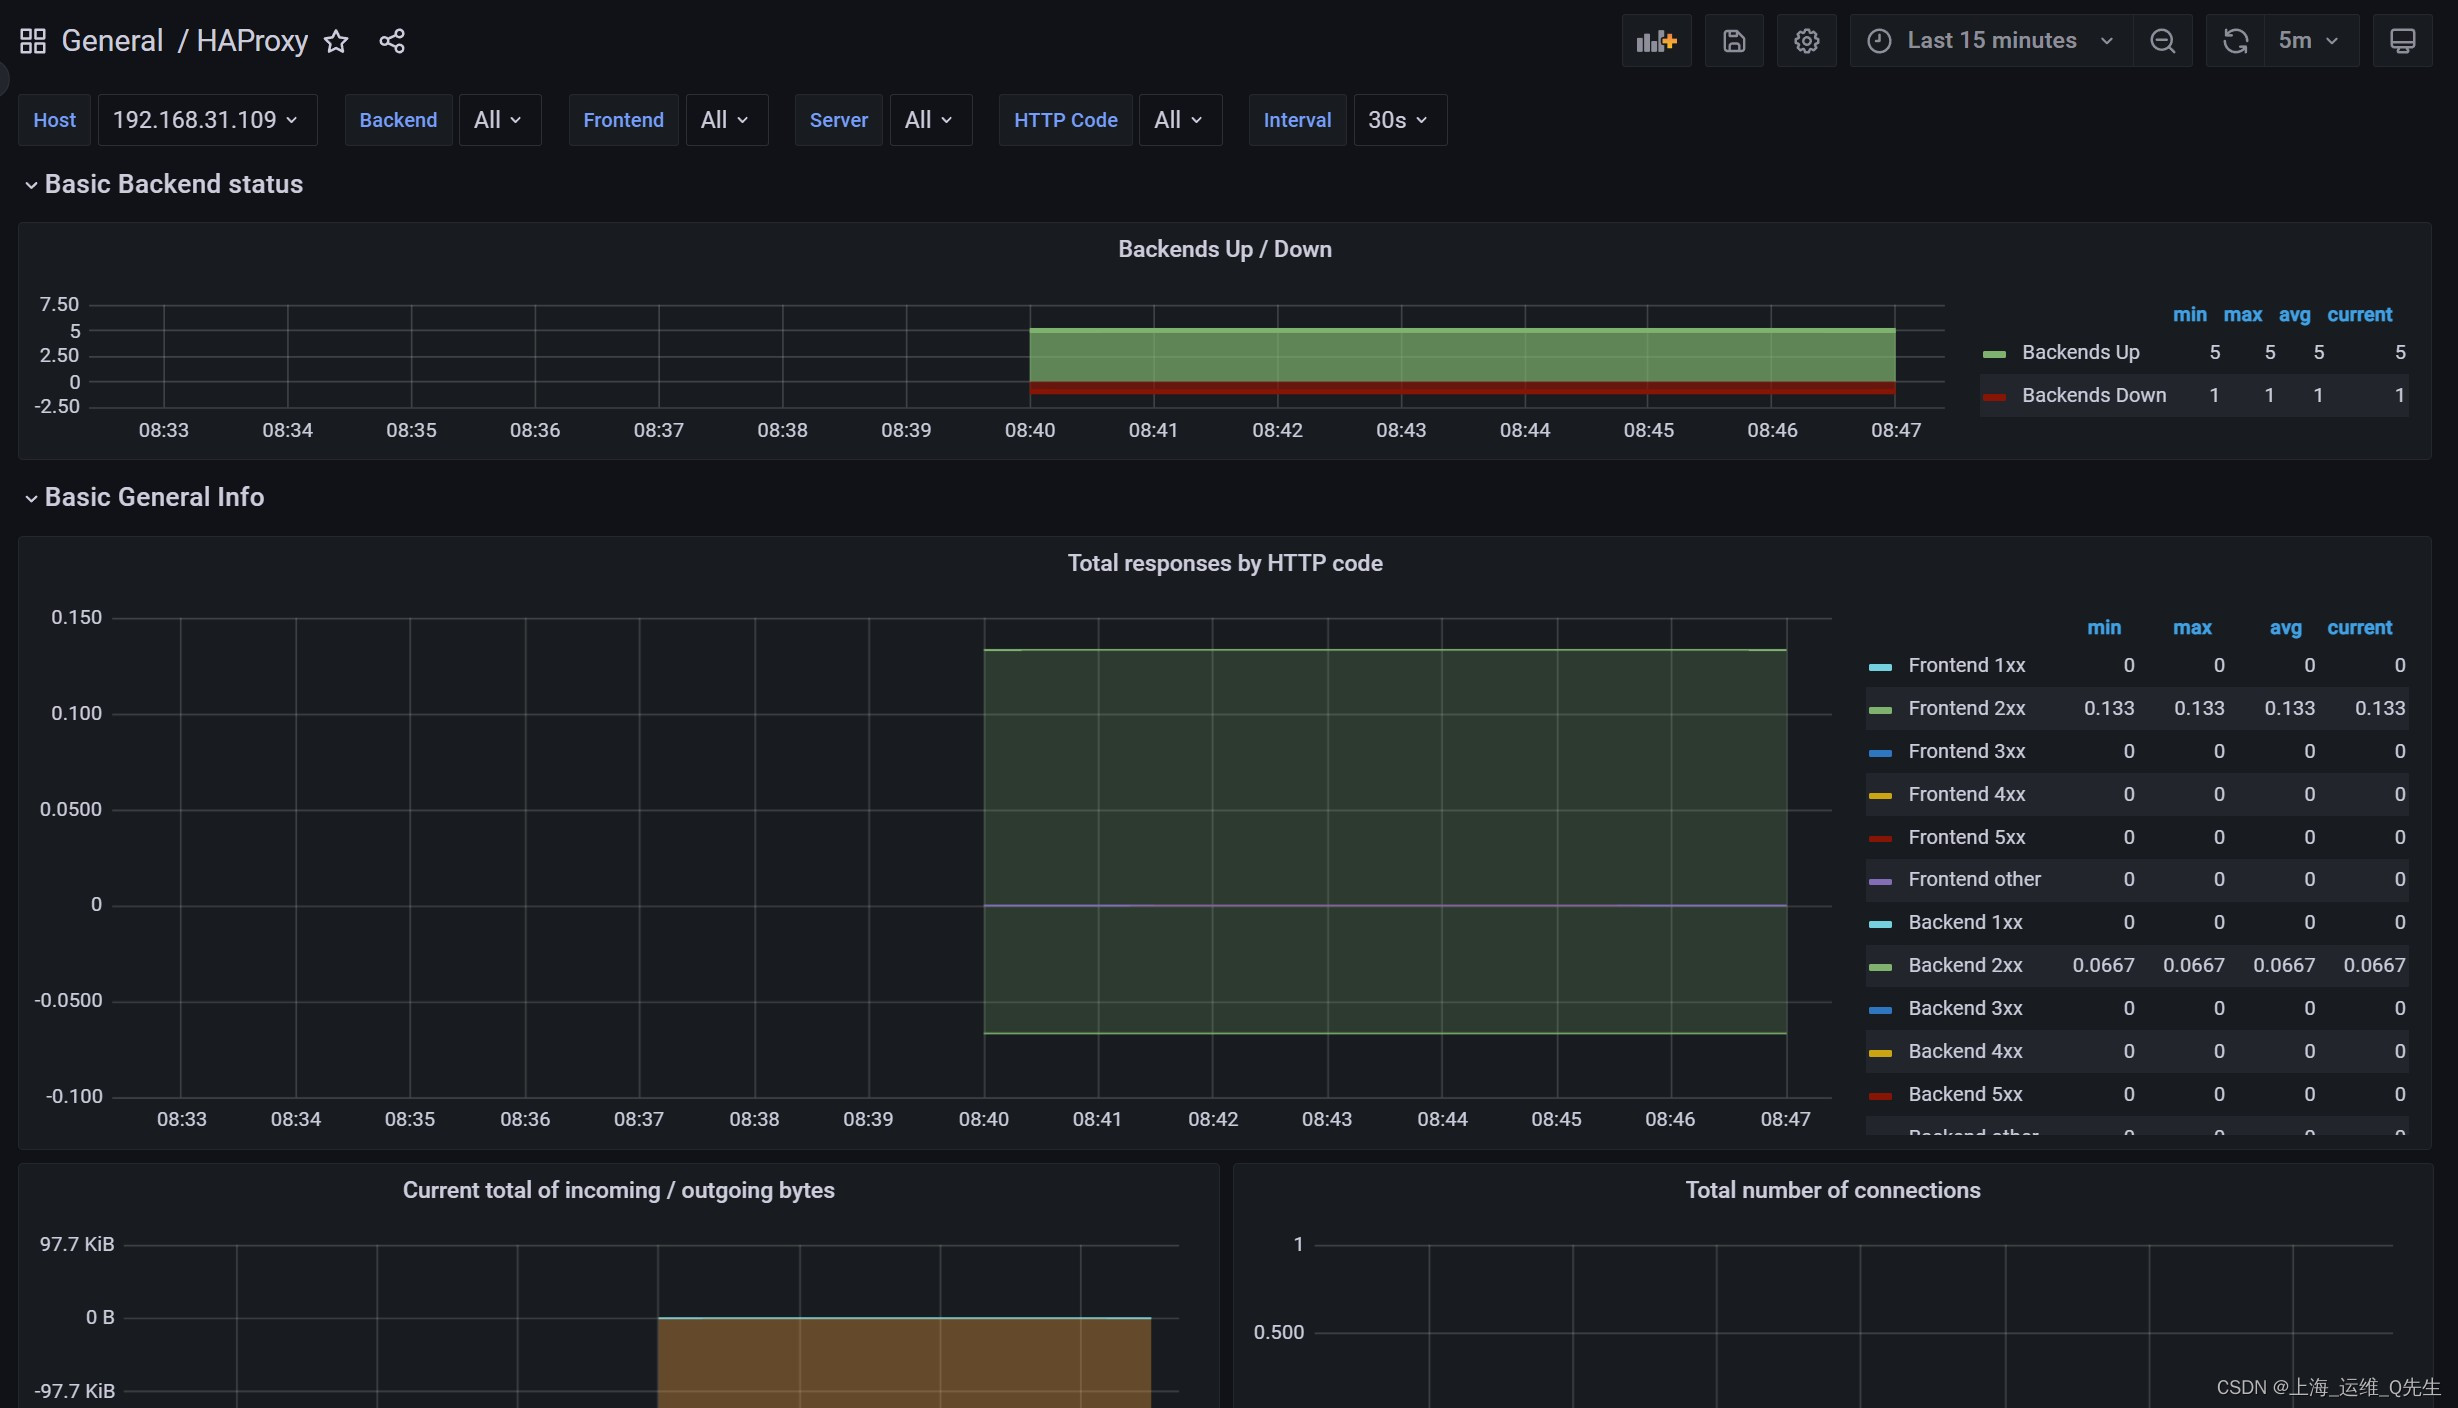
4. Grafana导入Haproxy监控
364
367
2428
相关文章
- 通过Kubernetes监控探索应用架构,发现预期外的流量
- SpringCloud 应用在 Kubernetes 上的最佳实践 — 线上发布(可监控)
- linux(centos8):kubeadm单机安装kubernetes(kubernetes 1.18.3)
- Kubernetes详解(二)——Kubernetes结构与资源对象
- 【云原生 | Kubernetes 系列】---Skywalking部署和监控
- 【云原生 | Kubernetes 系列】---Prometheus监控Redis
- Kubernetes基础自学系列 | 汇总
- 【云原生之kubernetes实战】kubernetes集群的HPA弹性伸缩
- 【云原生之kubernetes】kubernetes集群下ConfigMap使用方法
- Kubernetes(k8s)API Server详解
- Kubernetes 将应用迁移至kubernetes
- kubernetes CNI Flannel 网络分析
- Kubernetes 集群权限管理RBAC
- 【云原生 | Kubernetes 系列】---Prometheus Blackbox_exporter监控
- 【云原生 | Kubernetes 系列】---Prometheus监控Nginx
- 【云原生 | Kubernetes 系列】----使用Prometheus监控K8s集群