
kube-prometheus 监控ElasticSearch
监控elasticsearch Prometheus Kube
2023-09-14 09:15:47 时间
一、操作步骤
1.1 创建es-exporter
创建es-exporer.yaml,请根据实际情况修改namespace
apiVersion: apps/v1
kind: Deployment
metadata:
  name: es-exporter
  namespace: logging
spec:
  replicas: 1
  strategy:
    rollingUpdate:
      maxSurge: 1
      maxUnavailable: 0
    type: RollingUpdate
  selector:
    matchLabels:
      app: es-exporter
  template:
    metadata:
      labels:
        app: es-exporter
    spec:
      containers:
        - command:
            - /bin/elasticsearch_exporter
            - --es.uri=http://10.11.11.11:9200
            - --es.all
          image: quay.io/prometheuscommunity/elasticsearch-exporter:latest
          securityContext:
            capabilities:
              drop:
                - SETPCAP
                - MKNOD
                - AUDIT_WRITE
                - CHOWN
                - NET_RAW
                - DAC_OVERRIDE
                - FOWNER
                - FSETID
                - KILL
                - SETGID
                - SETUID
                - NET_BIND_SERVICE
                - SYS_CHROOT
                - SETFCAP
            readOnlyRootFilesystem: true
          livenessProbe:
            httpGet:
              path: /healthz
              port: 9114
            initialDelaySeconds: 30
            timeoutSeconds: 10
          name: es-exporter
          ports:
            - containerPort: 9114
              name: http
          readinessProbe:
            httpGet:
              path: /healthz
              port: 9114
            initialDelaySeconds: 10
            timeoutSeconds: 10
          resources:
            limits:
              cpu: 100m
              memory: 128Mi
            requests:
              cpu: 25m
              memory: 64Mi
      restartPolicy: Always
      securityContext:
        runAsNonRoot: true
        runAsGroup: 10000
        runAsUser: 10000
        fsGroup: 10000
---
apiVersion: v1
kind: Service
metadata:
  labels:
    app: es-exporter
  name: es-exporter
  namespace: logging
spec:
  ports:
  - name: metric-port
    port: 9114
    protocol: TCP
    targetPort: 9114
  type: NodePort
  selector:
    app: es-exporter
创建exporter
kubectl create -f es-exporter.yaml查看资源
kubectl get pod -n logging|grep es
es-exporter-67b54f8f66-wl6cj      1/1     Running   0          20h
1.2 创建servicemonitor的crd对象
创建servicemonitor.yaml,其metadat的label要和prometheus的crd对应的serviceMonitorSelector匹配
apiVersion: monitoring.coreos.com/v1
kind: ServiceMonitor
metadata:
labels:
app: es-exporter
release: p
# 填写一个唯一名称
name: es-exporter
# 填写目标命名空间
namespace: monitoring
spec:
endpoints:
- interval: 30s
# es Grafana 模版 ID 为2322
# 填写 service.yaml 中 Prometheus Exporter 对应的 Port 的 Name 字段的值
port: metric-port
#填写 Prometheus Exporter 代码中暴露的地址
path: /metrics
namespaceSelector:
any: true
# Nginx Demo 的命名空间
selector:
matchLabels:
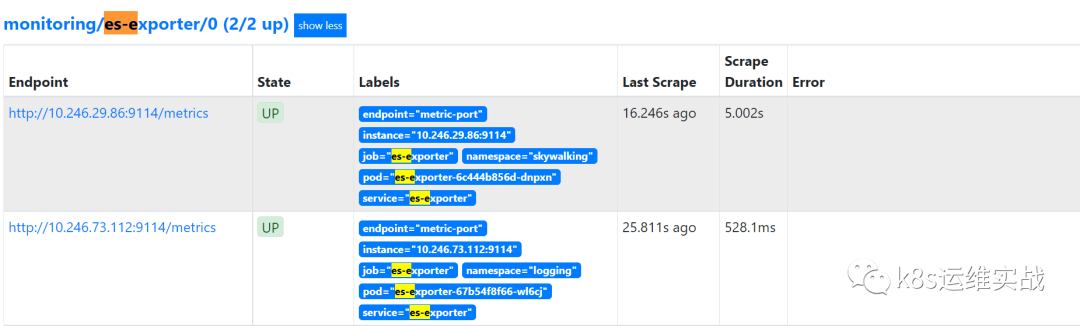
app: es-exporter1.3 查看target
prometheus自动发现了es-exporter
1.4 登录grafana,导入模板
https://grafana.com/grafana/dashboards/2322
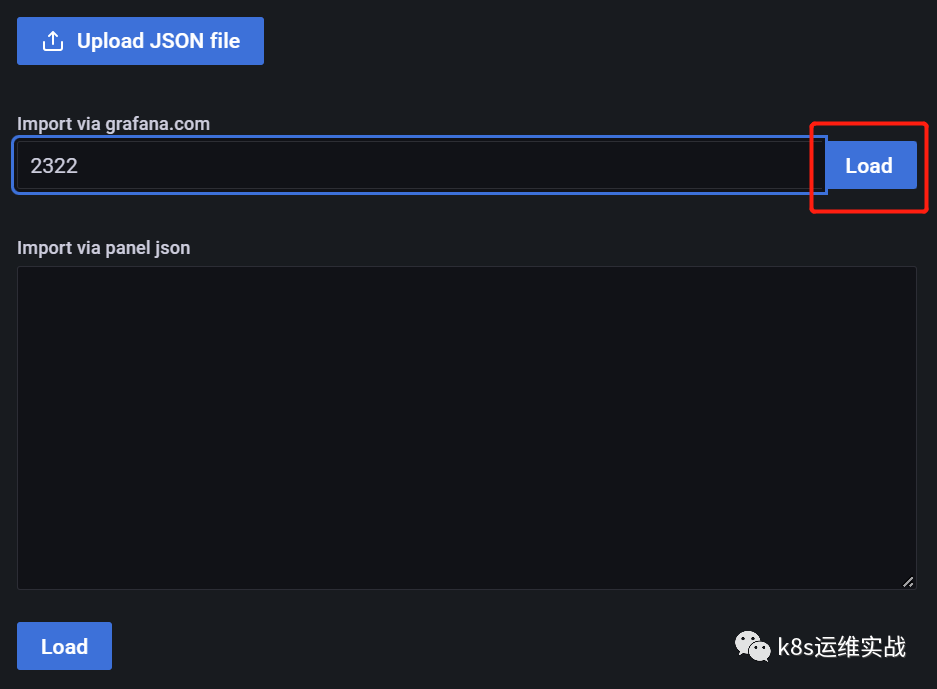
然后选择数据源

效果如下:
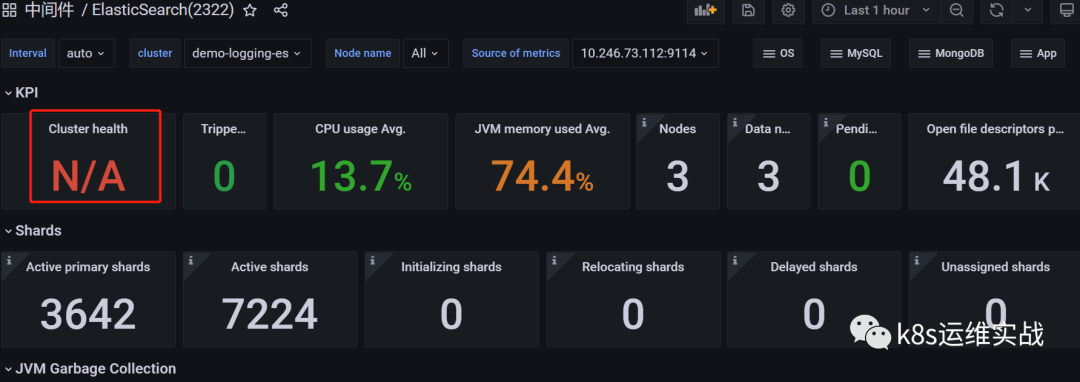
1.5解决Cluster health监控显示为N/A 问题
选中cluster health,选择Edit

鼠标移动到右测,修改下拉框内的值

改为如下图所示,然后点击,apply,save保存模板
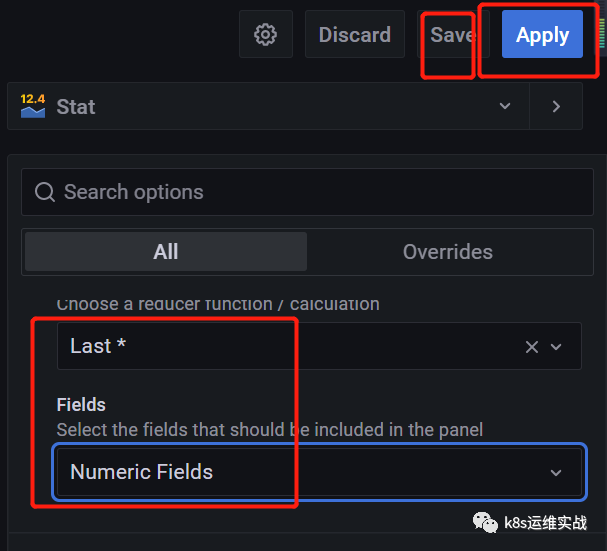
修改后clusterhealth 图表显示正常了。

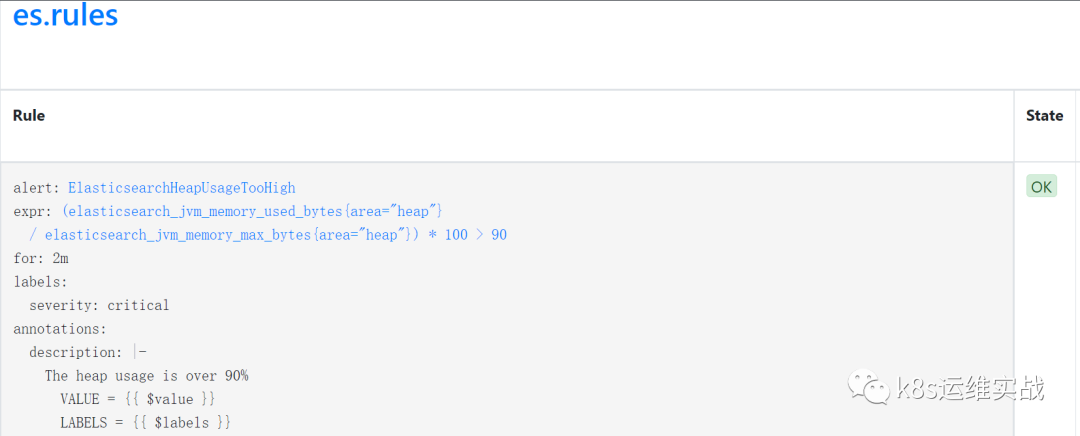
1.6 配置prometheusrule
创建es-rule.yaml
apiVersion: monitoring.coreos.com/v1
kind: PrometheusRule
metadata:
  labels:
    prometheus: k8s
    role: alert-rules
  name: es-rules
  namespace: monitoring
spec:
  groups:
  - name: es.rules
    rules:
    - alert: ElasticsearchHeapUsageTooHigh
      expr: (elasticsearch_jvm_memory_used_bytes{area="heap"} / elasticsearch_jvm_memory_max_bytes{area="heap"}) * 100 > 90
      for: 2m
      labels:
        severity: critical
      annotations:
        summary: Elasticsearch Heap Usage Too High (instance {{ $labels.instance }})
        description: "The heap usage is over 90%\n  VALUE = {{ $value }}\n  LABELS = {{ $labels }}"
    - alert: ElasticsearchHeapUsageWarning
      expr: (elasticsearch_jvm_memory_used_bytes{area="heap"} / elasticsearch_jvm_memory_max_bytes{area="heap"}) * 100 > 80
      for: 2m
      labels:
        severity: warning
      annotations:
        summary: Elasticsearch Heap Usage warning (instance {{ $labels.instance }})
        description: "The heap usage is over 80%\n  VALUE = {{ $value }}\n  LABELS = {{ $labels }}"
    - alert: ElasticsearchDiskOutOfSpace
      expr: elasticsearch_filesystem_data_available_bytes / elasticsearch_filesystem_data_size_bytes * 100 < 10
      for: 0m
      labels:
        severity: critical
      annotations:
        summary: Elasticsearch disk out of space (instance {{ $labels.instance }})
        description: "The disk usage is over 90%\n  VALUE = {{ $value }}\n  LABELS = {{ $labels }}"
    - alert: ElasticsearchDiskSpaceLow
      expr: elasticsearch_filesystem_data_available_bytes / elasticsearch_filesystem_data_size_bytes * 100 < 20
      for: 2m
      labels:
        severity: warning
      annotations:
        summary: Elasticsearch disk space low (instance {{ $labels.instance }})
        description: "The disk usage is over 80%\n  VALUE = {{ $value }}\n  LABELS = {{ $labels }}"
    - alert: ElasticsearchClusterRed
      expr: elasticsearch_cluster_health_status{color="red"} == 1
      for: 0m
      labels:
        severity: critical
      annotations:
        summary: Elasticsearch Cluster Red (instance {{ $labels.instance }})
        description: "Elastic Cluster Red status\n  VALUE = {{ $value }}\n  LABELS = {{ $labels }}"
    - alert: ElasticsearchClusterYellow
      expr: elasticsearch_cluster_health_status{color="yellow"} == 1
      for: 0m
      labels:
        severity: warning
      annotations:
        summary: Elasticsearch Cluster Yellow (instance {{ $labels.instance }})
        description: "Elastic Cluster Yellow status\n  VALUE = {{ $value }}\n  LABELS = {{ $labels }}"
    - alert: ElasticsearchHealthyNodes
      expr: elasticsearch_cluster_health_number_of_nodes < 3
      for: 0m
      labels:
        severity: critical
      annotations:
        summary: Elasticsearch Healthy Nodes (instance {{ $labels.instance }})
        description: "Missing node in Elasticsearch cluster\n  VALUE = {{ $value }}\n  LABELS = {{ $labels }}"
    - alert: ElasticsearchHealthyDataNodes
      expr: elasticsearch_cluster_health_number_of_data_nodes < 3
      for: 0m
      labels:
        severity: critical
      annotations:
        summary: Elasticsearch Healthy Data Nodes (instance {{ $labels.instance }})
        description: "Missing data node in Elasticsearch cluster\n  VALUE = {{ $value }}\n  LABELS = {{ $labels }}"
    - alert: ElasticsearchRelocatingShards
      expr: elasticsearch_cluster_health_relocating_shards > 0
      for: 0m
      labels:
        severity: info
      annotations:
        summary: Elasticsearch relocating shards (instance {{ $labels.instance }})
        description: "Elasticsearch is relocating shards\n  VALUE = {{ $value }}\n  LABELS = {{ $labels }}"
    - alert: ElasticsearchRelocatingShardsTooLong
      expr: elasticsearch_cluster_health_relocating_shards > 0
      for: 15m
      labels:
        severity: warning
      annotations:
        summary: Elasticsearch relocating shards too long (instance {{ $labels.instance }})
        description: "Elasticsearch has been relocating shards for 15min\n  VALUE = {{ $value }}\n  LABELS = {{ $labels }}"
    - alert: ElasticsearchInitializingShards
      expr: elasticsearch_cluster_health_initializing_shards > 0
      for: 0m
      labels:
        severity: info
      annotations:
        summary: Elasticsearch initializing shards (instance {{ $labels.instance }})
        description: "Elasticsearch is initializing shards\n  VALUE = {{ $value }}\n  LABELS = {{ $labels }}"
    - alert: ElasticsearchInitializingShardsTooLong
      expr: elasticsearch_cluster_health_initializing_shards > 3
      for: 15m
      labels:
        severity: warning
      annotations:
        summary: Elasticsearch initializing shards too long (instance {{ $labels.instance }})
        description: "Elasticsearch has been initializing shards for 15 min\n  VALUE = {{ $value }}\n  LABELS = {{ $labels }}"
    - alert: ElasticsearchUnassignedShards
      expr: elasticsearch_cluster_health_unassigned_shards > 0
      for: 0m
      labels:
        severity: critical
      annotations:
        summary: Elasticsearch unassigned shards (instance {{ $labels.instance }})
        description: "Elasticsearch has unassigned shards\n  VALUE = {{ $value }}\n  LABELS = {{ $labels }}"
    - alert: ElasticsearchPendingTasks
      expr: elasticsearch_cluster_health_number_of_pending_tasks > 0
      for: 15m
      labels:
        severity: warning
      annotations:
        summary: Elasticsearch pending tasks (instance {{ $labels.instance }})
        description: "Elasticsearch has pending tasks. Cluster works slowly.\n  VALUE = {{ $value }}\n  LABELS = {{ $labels }}"
    - alert: ElasticsearchNoNewDocuments
      expr: increase(elasticsearch_indices_docs{es_data_node="true"}[10m]) < 1
      for: 0m
      labels:
        severity: warning
      annotations:
        summary: Elasticsearch no new documents (instance {{ $labels.instance }})
        description: "No new documents for 10 min!\n  VALUE = {{ $value }}\n  LABELS = {{ $labels }}"
创建es-rules
kubectl apply -f es-rule.yaml登录prometheus,查看Rules
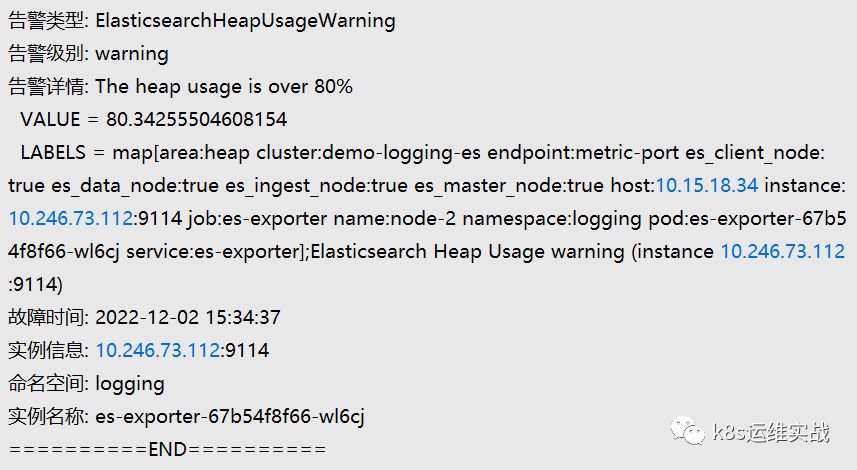
1.7测试告警
相关文章
- 监控系统架构方案
- 【鹅厂网事】大型互联网公司海量监控系统设计
- 动手体验 ES 8.4.x 实时监控 Java 应用运行状态
- Prometheus 监控Linux Windows主机(七)
- 写了个监控 ElasticSearch 进程异常的脚本!
- 某小区监控系统改造设计方案,非常详细,文末word直链下载!
- 系统使用lr进行Linux系统监控(lr监控linux)
- Redis性能监控指标汇总
- Cacti+Nagios(七):Nagios监控windows(基于check_nt)
- 【工具推荐】Linux 内存监控必备!25字助你掌握内存情况(linux内存监控工具)
- Linux监控系统:开源智能解决方案(linux监控开源)
- 国内第一套自主可控700兆瓦水电站智能监控上线:采用国产飞腾CPU
- 监测Redis的执行情况,确保其顺利运行(监控redis的执行)
- Zabbix监控Linux主机设置方法