
Qt使用QCustomplot图形库
Qt 使用
2023-09-14 09:05:26 时间
1、前言
在最近的项目中需要显示一些图形和图表,博主感觉Qt自带的 QtCharts 比较简陋,于是往第三方库上考虑。对比了QCustomplot、QWT、ECharts等一些比较热门的图形库,博主这里选择了QCustomplot,这章节记录一下使用过程,方便后期回顾。
QCustomPlot 是一个基于Qt C++的图形库,用于绘制和数据可视化,并为实时可视化应用程序提供高性能服务。它没有进一步的依赖关系,并有着良好的文档记录。只需要在项目中加入头文件 qcustomplot.h 和 qcustomplot.cpp 文件,然后使一个widget提升为 QCustomPlot 类,即可使用。
本文福利,莬费领取Qt开发学习资料包、技术视频,内容包括(C++语言基础,Qt编程入门,QT信号与槽机制,QT界面开发-图像绘制,QT网络,QT数据库编程,QT项目实战,QSS,OpenCV,Quick模块,面试题等等)↓↓↓↓↓↓见下面↓↓文章底部点击莬费领取↓↓
下载
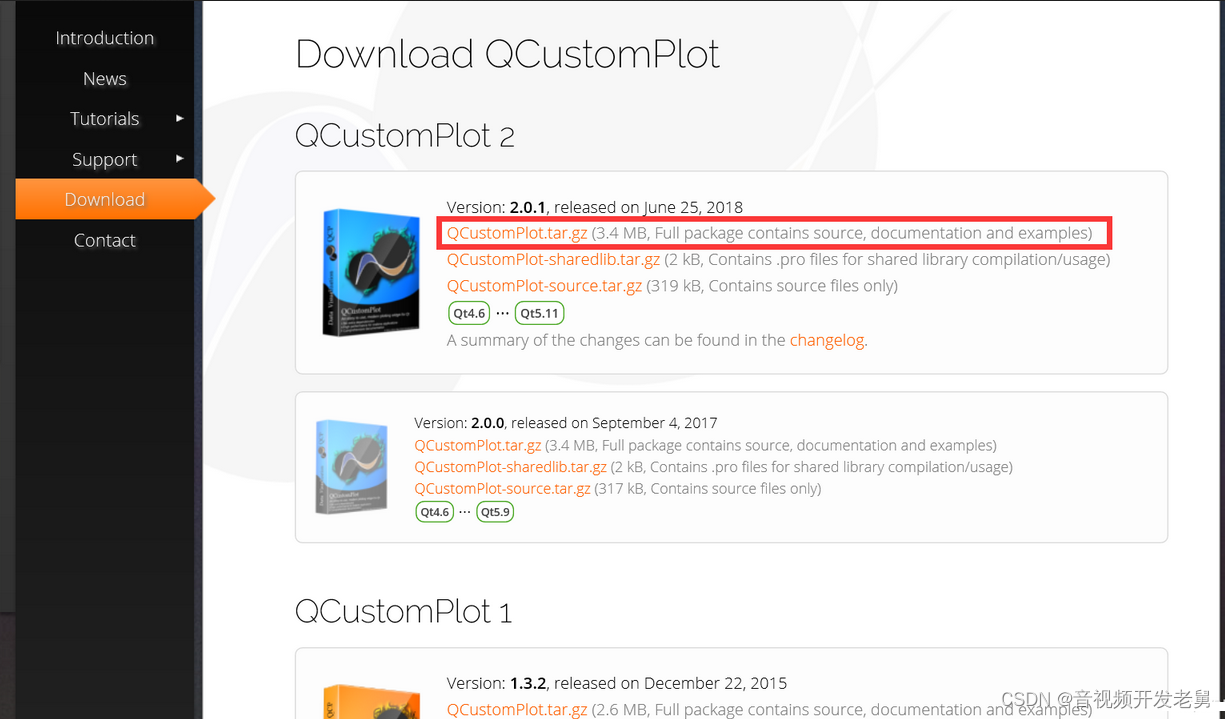
官网下载:QCustomPlot 2
选择带有源代码、帮助文档和示例的资源包
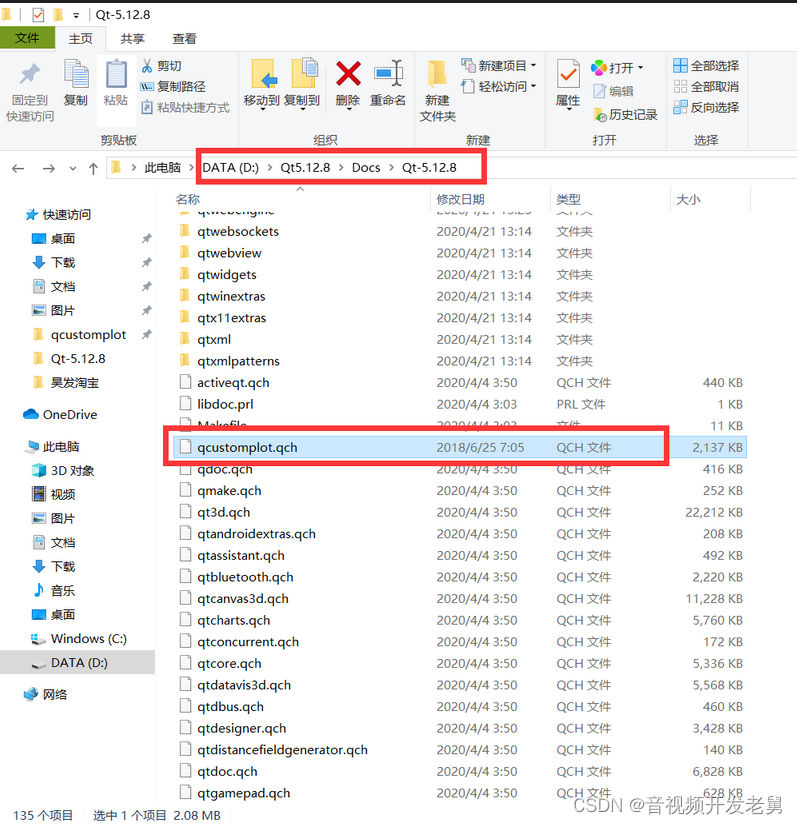
导入帮助文档
- 把 QCustomPlot 2.0.1\documentation\qcustomplot.qch 拷贝到Qt的帮助文档目录 Qt\Qt5.12.8\Docs\Qt-5.12.8 下面
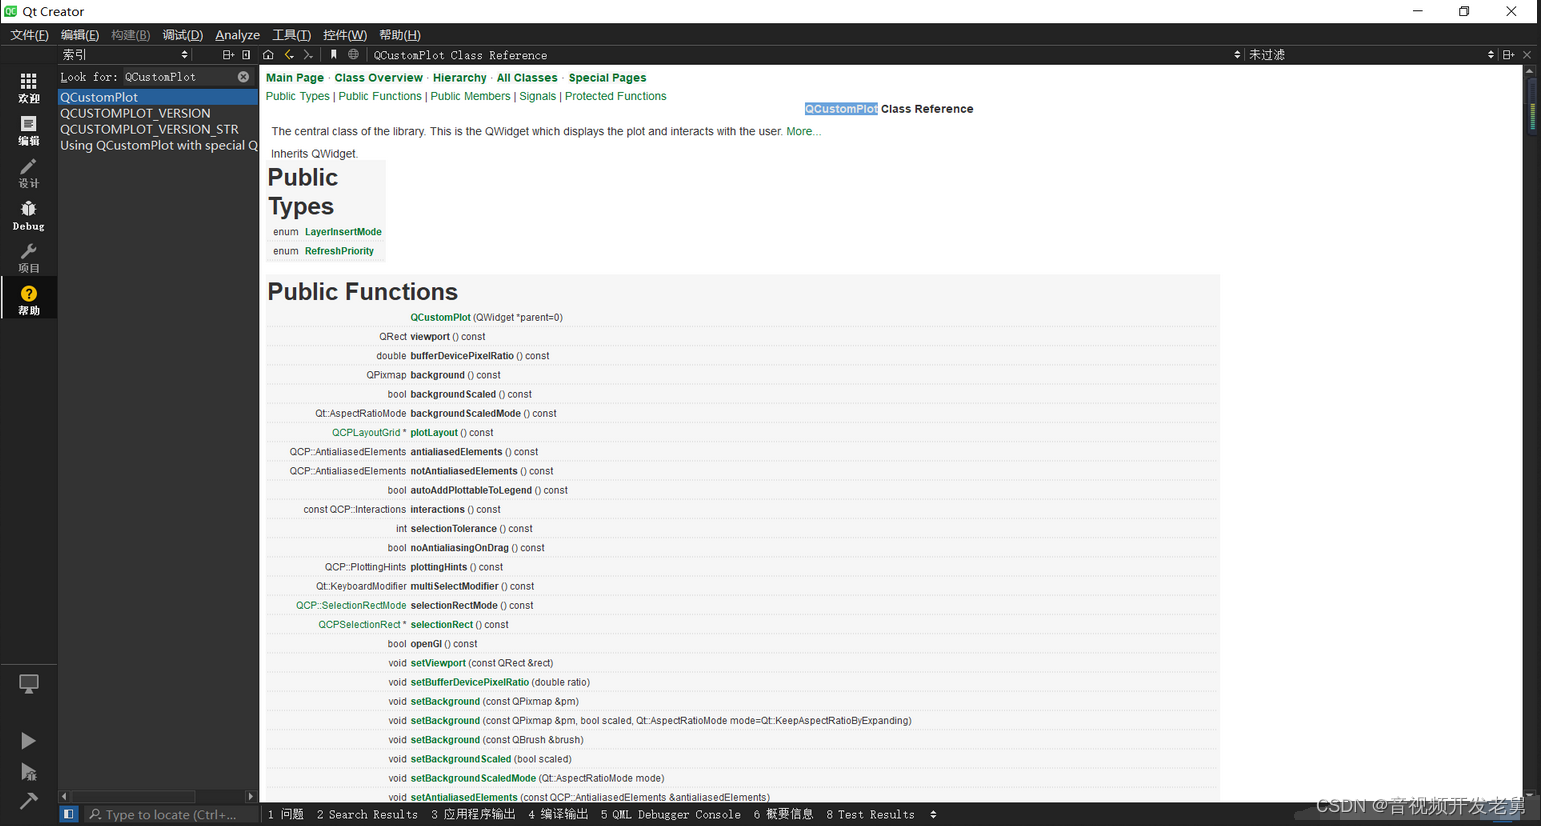
在Qt中导入文档

可以在Qt帮助文档中查看 QCustomPlot 类的属性和方法
配置
- 在pro中添加printsupport模块由于QCustomPlot中存在导出功能,使用了printsupport模块):
QT += printsupport - 在项目中导入 qcustomplot.h 和 qcustomplot.cpp
以色谱图为例
QCustomPlot *customPlot = new QCustomPlot(this);		// QCustomPlot  继承自QWidget,一个独立窗口
customPlot->setFixedSize(200, 200);				// 设置窗口大小

QCPColorScale *colorScale = new QCPColorScale(customPlot);	// 颜色滚动条
colorScale->axis()->setTicks(true);				// 设置标签可见
colorScale->axis()->setRange(0, 1);				// 设置范围
colorScale->setType(QCPAxis::atRight);				// 设置显示位置
colorScale->setRangeDrag(false);				// 设置不能拖动
colorScale->setRangeZoom(false);				// 设置不能滚动
colorScale->setBarWidth(8);					// 设置宽度为8

QCPColorMap *colorMap = new QCPColorMap(customPlot->xAxis, customPlot->yAxis);
colorMap->data()->setSize(200, 200);				// 调整数据数组的大小,key和value都是200
colorMap->data()->setRange(QCPRange(0, 200), QCPRange(0, 200));	// 设置key和value的范围都是0-200
colorMap->setColorScale(colorScale);				// 设置色谱图的颜色滚动条
colorMap->setGradient(QCPColorGradient::gpPolar);		// 设置用于表示数据的颜色渐变
colorMap->rescaleDataRange(true);				// 设置数据范围以跨越当前数据集中出现的最小值和最大值

customPlot->plotLayout()->addElement(0, 1, colorScale);		// 将元素添加到具有行和列的单元格中
customPlot->rescaleAxes();					// 重新缩放轴,使绘图中的所有绘图表完全可见
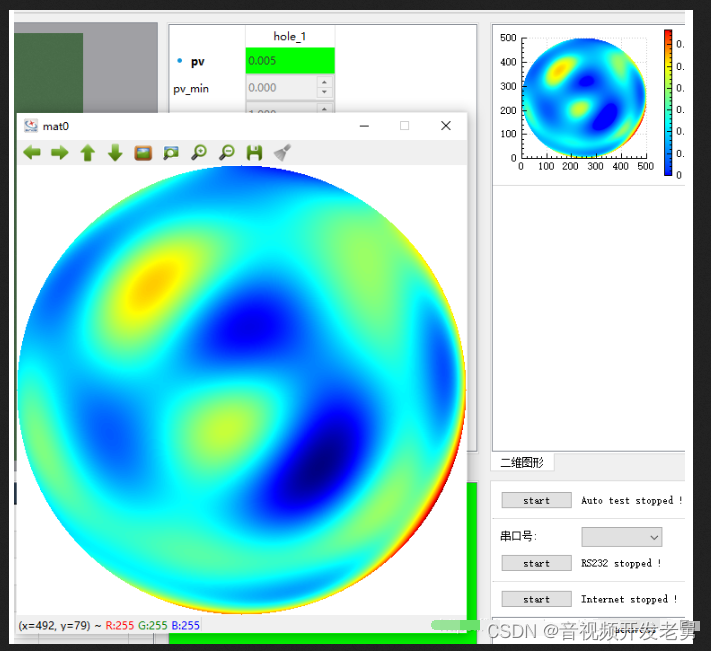
以下是我的应用,显示openCV处理过的图像
QApplication::processEvents();

ui->view_table->clearContents();
for ( int i = 0; i < m_algorithmList.size(); ++i )
{
    QCustomPlot *customPlot = new QCustomPlot(ui->view_table);
    customPlot->setFixedSize(ui->view_table->width() - 20, ui->view_table->width() - 70);

    QCPColorScale *colorScale = new QCPColorScale(customPlot);
    colorScale->axis()->setTicks(true);
    colorScale->axis()->setRange(0, 1);
    colorScale->setType(QCPAxis::atRight);
    colorScale->setRangeDrag(false);
    colorScale->setRangeZoom(false);
    colorScale->setBarWidth(8);

    QCPColorMap *colorMap = new QCPColorMap(customPlot->xAxis, customPlot->yAxis);

    if ( m_algorithmList.at(i)->errorType == ERROR_TYPE_NOT_ERROR ) {
        cv::Mat mat = m_algorithmList.at(i)->fitttingSurface.clone();
        double minV = 0, maxV = 0;

        cv::minMaxIdx(mat, &minV, &maxV, nullptr, nullptr, mat == mat);
        if (abs(maxV - minV) > 0.00000001) {
            mat = (mat - minV) / (maxV - minV) * 255;
        }

        mat.convertTo(mat, CV_8UC1);
        cv::applyColorMap(mat, mat, COLORMAP_JET);

        cv::Mat tmpMask = m_algorithmList.at(i)->roiMask.clone();
        mat.setTo(cv::Vec3b(255, 255, 255), ~tmpMask);
        cv::imshow(QString("mat%1").arg(i).toStdString(), mat);

        //------------------------------------------------------------------------------

        int max = mat.cols >= mat.rows ? mat.cols : mat.rows;
        colorMap->data()->setSize(max, max);
        colorMap->data()->setRange(QCPRange(0, max), QCPRange(0, max));

        for ( int x = 0; x < mat.cols; ++x )
        {
            for ( int y = 0; y < mat.rows; ++y )
            {
                double r = mat.at<Vec3b>(y, x)[0];
                double g = mat.at<Vec3b>(y, x)[1];
                double b = mat.at<Vec3b>(y, x)[2];

                if ( r == 255 && g == 255 && b == 255 ) {
                    colorMap->data()->setAlpha(x, mat.rows - 1 - y, 0);
                } else {
                    QColor color(r, g, b);
                    colorMap->data()->setCell(x, mat.rows - 1 - y, color.hueF());
                }
            }
        }

        if ( mat.cols >= mat.rows ) {
            for ( int x = mat.rows; x < mat.cols; ++x )
            {
                for ( int y = 0; y < mat.cols; ++y )
                {
                    colorMap->data()->setAlpha(y, x, 0);
                }
            }
        } else {
            for ( int x = mat.cols; x < mat.rows; ++x )
            {
                for ( int y = 0; y < mat.rows; ++y )
                {
                    colorMap->data()->setAlpha(x, y, 0);
                }
            }
        }

    } else {
        colorMap->data()->setSize(200, 200);
        colorMap->data()->setRange(QCPRange(0, 200), QCPRange(0, 200));
    }

    QCPColorGradient cpg;
    cpg.setColorStopAt(0.005, QColor(0, 0, 255));       // blue
    cpg.setColorStopAt(0.025, QColor(0, 50, 255));      // light blue
    cpg.setColorStopAt(0.350, QColor(0, 255, 255));     // green
    cpg.setColorStopAt(0.750, QColor(255, 255, 0));     // yellow
    cpg.setColorStopAt(0.975, QColor(255, 30, 0));      // light red
    cpg.setColorStopAt(0.995, QColor(255, 0, 0));       // red

    colorMap->setColorScale(colorScale);
    colorMap->setGradient(cpg);
    colorMap->rescaleDataRange(true);

    customPlot->plotLayout()->addElement(0, 1, colorScale);
    customPlot->rescaleAxes();
    customPlot->replot();
    ui->view_table->setCellWidget(i, 0, customPlot);
}
和openCV直接imshow作比较
本文福利,莬费领取Qt开发学习资料包、技术视频,内容包括(C++语言基础,Qt编程入门,QT信号与槽机制,QT界面开发-图像绘制,QT网络,QT数据库编程,QT项目实战,QSS,OpenCV,Quick模块,面试题等等)↓↓↓↓↓↓见下面↓↓文章底部点击莬费领取↓↓
相关文章
- Qt-Qt之QDesktopWidget的使用说明(屏幕个数、屏幕分辩率、屏幕PDI、设置屏幕分辩率)
- Qt使用cos、sin绘制圆
- Qt编写自定义控件39-导航标签
- Qt编写地图综合应用48-地球模式、三维模式、地铁模式
- Qt编写数据可视化大屏界面电子看板系统
- QT开发之旅一DS7400主机调试工具
- paip.c++ qt creator svn 设置以及使用总结.
- Qt多线程间的互斥
- Qt Xlsx的基本使用
- Qt 日志功能(qDebug、qWarnng、qCritical、qFatal)
- Qt 添加菜单栏和工具栏
- Qt使用QAudioInput、QAudioOutput实现局域网的音频通话
- 使用QT绘制一个多边形
- 使用QT显示OpenCV读取的图片
- Qt QLabel show 显示图像、填充、缩放
- 在Qt中使用SQLite数据库
- qt中控件的使用函数
- 顺丰科技QT面试题
- Qt模拟鼠标点击事件
- QT使用系统默认程序打开文件
- QT中foreach的使用
- Qt 多线程使用moveToThread
- QT creator使用(四):布局管理系统
- Qt数据库应用10-通用数据库设置
- 使用Qt创建一个空的项目