
妙啊!这款 Python 数据可视化工具强的很!

使用 Altair ,你可以将更多时间专注于数据及其含义,下面我将详细介绍:
示例
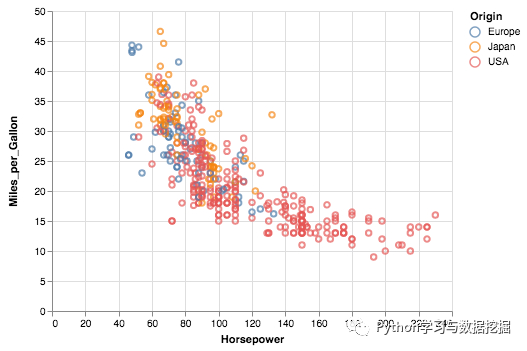
这是一个在 JupyterLab 中使用 Altair 快速可视化和显示数据集的示例:
import altair as alt
# load a simple dataset as a pandas DataFrame
from vega_datasets import data
cars = data.cars()
alt.Chart(cars).mark_point().encode(
    x='Horsepower',
    y='Miles_per_Gallon',
    color='Origin',
)
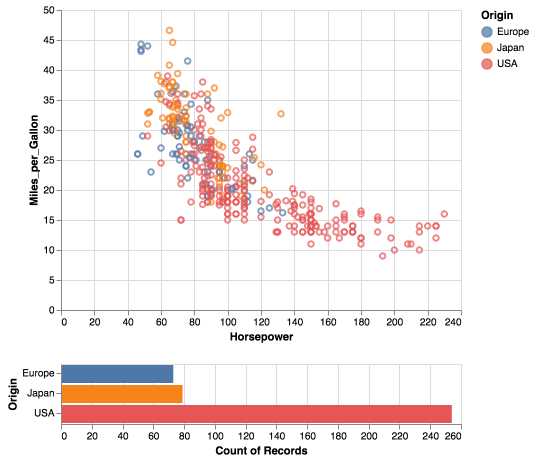
源自 Vega-Lite 的 Altair 的独特功能之一是声明性语法,它不仅具有可视化功能,还具有交互性。通过对上面的示例进行一些修改,我们可以创建一个链接的直方图,该直方图根据散点图的选择进行过滤。
import altair as alt
from vega_datasets import data
source = data.cars()
brush = alt.selection(type='interval')
points = alt.Chart(source).mark_point().encode(
    x='Horsepower',
    y='Miles_per_Gallon',
    color=alt.condition(brush, 'Origin', alt.value('lightgray'))
).add_selection(
    brush
)
bars = alt.Chart(source).mark_bar().encode(
    y='Origin',
    color='Origin',
    x='count(Origin)'
).transform_filter(
    brush
)
points & bars
安装方法
Altair需要以下依赖项:
- pandas
- traitlets
- IPython
如果已克隆存储库,请从存储库的根目录运行以下命令:
pip install -e .[dev]
如果你不想克隆存储库,则可以使用以下命令进行安装:
pip install git+https://github.com/altair-viz/altair
更多内容详情,可以查看github链接:
https://github.com/altair-viz/altair
三大操作
接下来,我将详细地介绍 Altair 如何创建过滤、分组和合并操作的可视化对象,可以将其用作探索性数据分析过程的一部分。
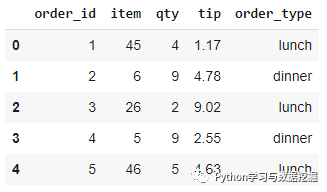
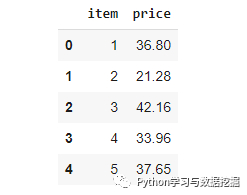
我们构建两个数据帧的模拟数据。第一个是餐厅订单,第二个是餐厅订单中的商品价格。
# import libraries
import numpy as np
import pandas as pd
import altair as alt
import random
# mock data
orders = pd.DataFrame({
   "order_id": np.arange(1,101),
   "item": np.random.randint(1, 50, size=100),
   "qty": np.random.randint(1, 10, size=100),
   "tip": (np.random.random(100) * 10).round(2)
})
prices = pd.DataFrame({
   "item": np.arange(1,51),
   "price": (np.random.random(50) * 50).round(2)
})
order_type = ["lunch", "dinner"] * 50
random.shuffle(order_type)
orders["order_type"] = order_type
首先,我们创建一个简单的图来 Altair 语法结构。
alt.Chart(orders).mark_circle(size=50).encode(
   x="qty", y="tip", color="order_type"
).properties(
   title = "Tip vs Quantity"
)
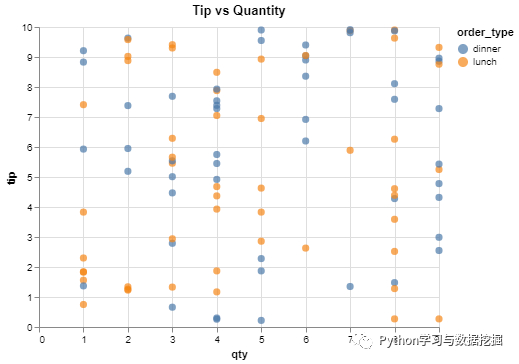
Altair 基本语法四步曲:
- 将数据传递到 Chart 对象,数据可以采用Pandas数据框或指向json或csv文件的URL字符串的形式。
- 选择可视化的类型(例如 mark_circle,mark_line 等)。
- encode 编码函数指定在给定数据帧中要绘制的内容。因此,我们在编码函数中编写的任何内容都必须链接到数据帧。
- 使用properties函数指定图的某些属性。
考虑这样一种情况,我们需要创建 pirce 和 tip 值的散点图,它们位于不同的数据帧中。一种选择是合并两个数据帧,并在散点图中使用这两列。
Altair提供了一种更实用的方法,它允许在其他数据框中查找列, 类似 Pandas 的 merge 函数功能相同。
alt.Chart(orders).mark_circle(size=50).encode(
   x="tip", y="price:Q", color="order_type"
).transform_lookup(
   lookup="item",
   from_=alt.LookupData(data=prices, key="item", fields=["price"])
).properties(
   title = "Price vs Tip"
)
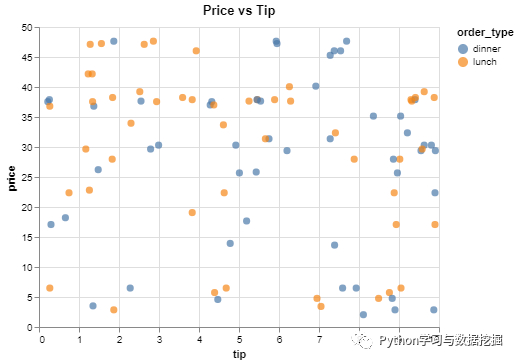
transform_lookup 函数类似于 Pandas 的 merge 函数。用于匹配观察值的列(即行)将传递给lookup参数。fields参数用于从另一个数据帧中选择所需的列。
我们还可以把过滤组件集成到绘图中,让我们绘制价格超过10美元的数据点。
alt.Chart(orders).mark_circle(size=50).encode(
   x="tip", y="price:Q", color="order_type"
).transform_lookup(
   lookup="item",
   from_=alt.LookupData(data=prices, key="item", fields=["price"])
).transform_filter(
   alt.FieldGTPredicate(field='price', gt=10)
).properties(
   title = "Price vs Tip"
)
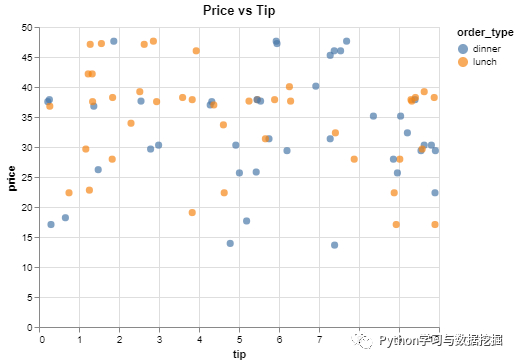
transform_filter 函数用于过滤。FieldGTPredicate处理"大于"的条件。
除了过滤和合并外,Altair 还允许在绘图之前对数据点进行分组。例如,我们可以创建一个条形图来显示每种订单类型的商品平均价格。此外,我们可以对价格低于20美元的商品执行此操作。
alt.Chart(orders).mark_bar().encode(
   y="order_type", x="avg_price:Q"
).transform_lookup(
   lookup="item",
   from_=alt.LookupData(data=prices, key="item", fields=["price"])
).transform_filter(
   alt.FieldLTPredicate(field='price', lt=20)
).transform_aggregate(
   avg_price = "mean(price)", groupby = ["order_type"]
).properties(
   height=200, width=300
)
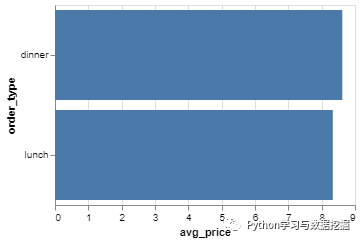
让我们详细说明每个步骤:
- transform_lookup:从价格数据框中查找价格。
- transform_filter:过滤价格低于20美元的价格。
- transform_aggregate:按订单类型对价格进行分组并计算均值。
结论
Altair 与其他常见的可视化库的不同之处在于,它可以无缝地将数据分析组件集成到可视化中,是一款非常实用的数据探索工具。
筛选、合并和分组对于探索性数据分析过程至关重要。Altair 允许在创建数据可视化时执行所有这些操作。从这个意义上讲,Altair也可以视为数据分析工具。如果你感兴趣,赶快尝试一下吧。
相关文章
- 基于Python的人脸识别考勤监控
- Python答题游戏
- Python调用百度API实现图像识别
- Python全栈疫情分析项目
- Python-基础-if语句快速入门
- Python-基础-循环语句快速入门
- Python-GUI签名
- 【2】VScode 搭建python和tensorflow环境
- python 简易时钟
- 【1】windows系统如何安装后缀是whl的python库
- 【2】超级详细Python-matplotlib画图,手把手教你画图!(线条颜色、大小、线形、标签)
- 【4】python读写文件操作---详细讲解!
- 【2】Anaconda下:ipython文件的打开方式,Jupyter Notebook中运行.py文件,快速打开ipython文件的方法!
- 【编写环境一】遇到常见python函数处理方式
- 【编写环境二】python库scipy.stats各种分布函数生成、以及随机数生成【泊松分布、正态分布等】
- Python xlwt数据保存到 Excel中以及xlrd读取excel文件画图
- 强化学习技巧三:Python多进程
- 强化学习技巧五:numba提速python程序
- 【7】python_matplotlib 输出(保存)矢量图方法;画图时图例说明(legend)放到图像外侧;Python_matplotlib图例放在外侧保存时显示不完整问题解决
- 【8】python_matplotlib改变横坐标和纵坐标上的刻度(ticks)、sagemath-list_plot()调整图例(legend)中点的数量、Matplotlib画各种论文图