
postgreSql分组统计数据的实现代码
比如气象台的气温监控,每半小时上报一条数据,有很多个地方的气温监控,这样数据表里就会有很多地方的不同时间的气温数据
2. 需求:每次查询只查最新的气温数据按照不同的温度区间来分组查出,比如:高温有多少地方,正常有多少地方,低温有多少地方
3. 构建数据3.1 创建表结构:
DROP TABLE public.t_temperature
CREATE TABLE public.t_temperature (
id int4 NOT NULL GENERATED ALWAYS AS IDENTITY,
place_name varchar NOT NULL,
value float8 NOT NULL,
up_time timestamp NOT NULL,
CONSTRAINT t_temperature_pk PRIMARY KEY (id)
);
Permissions
ALTER TABLE public.t_temperature OWNER TO postgres;
GRANT ALL ON TABLE public.t_temperature TO postgres;
3.2 造数据
INSERT INTO public.t_temperature (place_name,value,up_time) VALUES
( 广州 ,35, 2020-07-12 15:00:00.000 )
,( 广州 ,35.9, 2020-07-12 15:30:00.000 )
,( 深圳 ,30, 2020-07-12 15:30:00.000 )
,( 深圳 ,31, 2020-07-12 16:30:00.000 )
,( 三亚 ,23, 2020-07-12 16:30:00.000 )
,( 三亚 ,21, 2020-07-12 17:30:00.000 )
,( 北极 ,-1, 2020-07-12 17:30:00.000 )
,( 北极 ,-10, 2020-07-12 19:30:00.000 )
;
4.1 需求1的SQL语句
利用了postgreSql的一个函数:ROW_NUMBER() OVER( [ PRITITION BY col1] ORDER BY col2[ DESC ] )
select
*
from
(
select
tt.place_name,
tt.value,
tt.up_time,
row_number() over ( partition by tt.place_name
order by
tt.up_time desc) as row_num
from
t_temperature tt) aaa
where
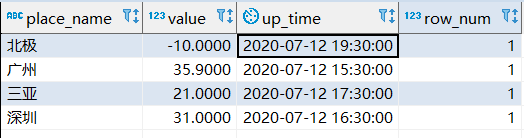
aaa.row_num = 1
效果如下,查出的都是最新的数据:
4.2 需求2的SQL语句
利用了一个case when then else end 用法来统计数量
select
dd.place_name,
sum(case when dd.value = 0 then 1 else 0 end) as 低温天气,
sum(case when dd.value 0 and dd.value 25 then 1 else 0 end) as 正常天气,
sum(case when dd.value = 25 then 1 else 0 end) as 高温天气
from
t_temperature dd
group by
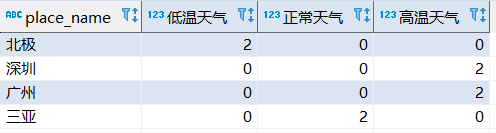
dd.place_name
效果如下,因为没有过滤每个地方的最新数据,查出的是所有数据:
用需求1的结果来查询统计:
select
dd.place_name,
sum(case when dd.value = 0 then 1 else 0 end) as 低温天气,
sum(case when dd.value 0 and dd.value 25 then 1 else 0 end) as 正常天气,
sum(case when dd.value = 25 then 1 else 0 end) as 高温天气
from
(
select
*
from
(
select
tt.place_name,
tt.value,
tt.up_time,
row_number() over ( partition by tt.place_name
order by
tt.up_time desc) as row_num
from
t_temperature tt) aaa
where
aaa.row_num = 1) dd
group by
dd.place_name
效果如下:
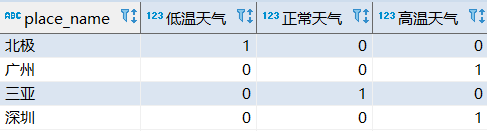
假如再嵌套一个sum统计,就能查出低温天气,正常天气,高温天气分别合计数量是多少了。
over,enjoy!
到此这篇关于postgreSql分组统计数据的文章就介绍到这了,更多相关postgreSql分组数据内容请搜索以前的文章或继续浏览下面的相关文章希望大家以后多多支持!
我想要获取技术服务或软件
服务范围:MySQL、ORACLE、SQLSERVER、MongoDB、PostgreSQL 、程序问题
服务方式:远程服务、电话支持、现场服务,沟通指定方式服务
技术标签:数据恢复、安装配置、数据迁移、集群容灾、异常处理、其它问题
本站部分文章参考或来源于网络,如有侵权请联系站长。
数据库远程运维 postgreSql分组统计数据的实现代码
相关文章
- POSTGRESQL postgresql 升级的需求来自哪里
- 云原生分布式 PostgreSQL+Citus 集群在 Sentry 后端的实践
- 详解PostgreSQL 数据库 自动Vacuum配置方式
- 对Postgresql中的json和array使用介绍
- 15个postgresql数据库实用命令分享
- PostgreSQL连接python,postgresql在python 连接,创建表,创建表内容,插入操作,选择操作,更新操作,删除操作。详解数据库
- 用户PostgreSQL的新用户:创建步骤(postgresql新建)
- 请聆听:Postgresql发音(postgresql发音)
- 使用阿里云PostgreSQL轻松搭建数据库(阿里云postgresql)
- 能力 PostgreSQL的强大并发能力(postgresql并发)
- 基于Zabbix的PostgreSQL数据库监控(zabbix监控postgresql)
- 玩转PostgreSQL数据库:学习如何处理除法(postgresql除法)
- PostgreSQL接口:轻松连接数据库(postgresql接口)
- PostgreSQL:轻松入门的开源数据库(postgresql介绍)
- Postgresql操作指南:极致生产力体系构建(postgresql操作)
- 修复PostgreSQL:解决数据库难题(postgresql问题)
- 编译PostgreSQL:一步一步实现数据库功能(postgresql编译)
- PostgreSQL文档:完整的指南和参考资料(postgresql文档)
- 管理Postgresql版本管理:实现更加高效的工作(postgresql版本)
- Postgresql数据库实现事务回滚技术(postgresql回滚)
- PostgreSQL登录:实现无缝连接(postgresql登录)