
[Python] Statistical analysis of time series
Global Statistics:
Common seen methods as such
1. Mean
2. Median
3. Standard deviation: the larger the number means it various a lot.
4. Sum.
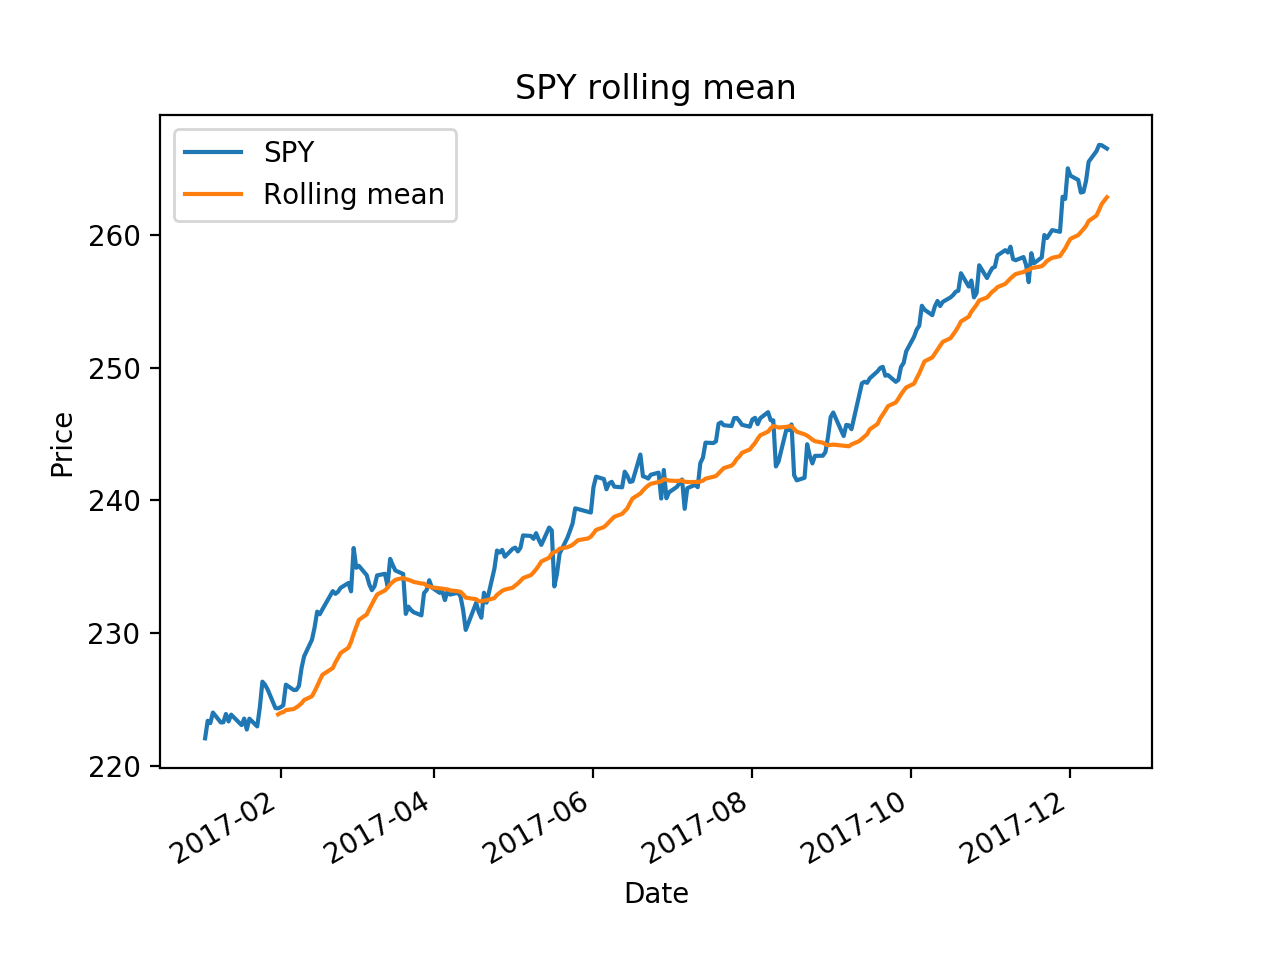
Rolling Statistics:
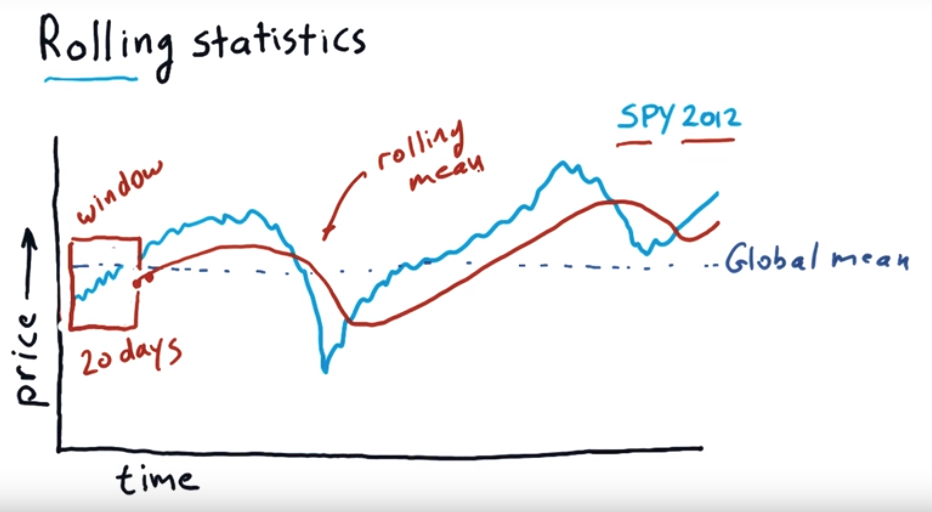
It use a time window, moving forward each day to calculate the mean value of those window periods.
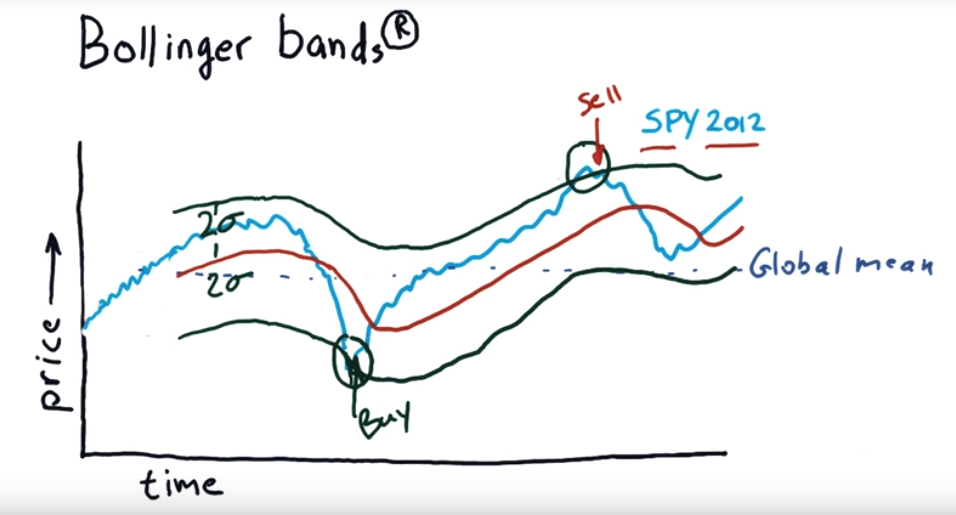
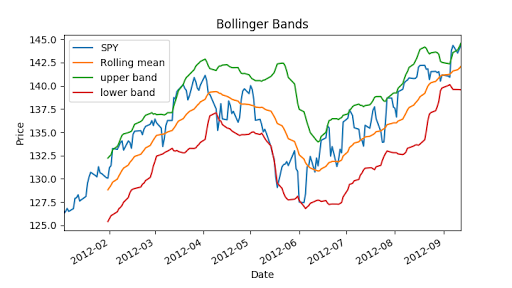
To find which day is good to buy which day is good for sell, we can use Bollinger bands.
Bollinger bands:
import os
import pandas as pd
import matplotlib.pyplot as plt

def test_run():
    start_date='2017-01-01'
    end_data='2017-12-15'
    dates=pd.date_range(start_date, end_data)

    # Create an empty data frame
    df=pd.DataFrame(index=dates)

    symbols=['SPY', 'AAPL', 'IBM', 'GOOG', 'GLD']
    for symbol in symbols:
        temp=getAdjCloseForSymbol(symbol)
        df=df.join(temp, how='inner')

    return df

if __name__ == '__main__':
    df=test_run()
    # data=data.ix['2017-12-01':'2017-12-15', ['IBM', 'GOOG']]
    # df=normalize_data(df)
    ax = df['SPY'].plot(title="SPY rolling mean", label='SPY')
    rm = df['SPY'].rolling(20).mean()
    rm.plot(label='Rolling mean', ax=ax)
    ax.set_xlabel('Date')
    ax.set_ylabel('Price')
    ax.legend(loc="upper left")
    plt.show()
Now we can calculate Bollinger bands, it is 2 times std value.
"""Bollinger Bands."""

import os
import pandas as pd
import matplotlib.pyplot as plt

def symbol_to_path(symbol, base_dir="data"):
    """Return CSV file path given ticker symbol."""
    return os.path.join(base_dir, "{}.csv".format(str(symbol)))


def get_data(symbols, dates):
    """Read stock data (adjusted close) for given symbols from CSV files."""
    df = pd.DataFrame(index=dates)
    if 'SPY' not in symbols:  # add SPY for reference, if absent
        symbols.insert(0, 'SPY')

    for symbol in symbols:
        df_temp = pd.read_csv(symbol_to_path(symbol), index_col='Date',
                parse_dates=True, usecols=['Date', 'Adj Close'], na_values=['nan'])
        df_temp = df_temp.rename(columns={'Adj Close': symbol})
        df = df.join(df_temp)
        if symbol == 'SPY':  # drop dates SPY did not trade
            df = df.dropna(subset=["SPY"])

    return df


def plot_data(df, title="Stock prices"):
    """Plot stock prices with a custom title and meaningful axis labels."""
    ax = df.plot(title=title, fontsize=12)
    ax.set_xlabel("Date")
    ax.set_ylabel("Price")
    plt.show()


def get_rolling_mean(values, window):
    """Return rolling mean of given values, using specified window size."""
    return values.rolling(window=window).mean()


def get_rolling_std(values, window):
    """Return rolling standard deviation of given values, using specified window size."""
    # TODO: Compute and return rolling standard deviation
    return values.rolling(window=window).std()


def get_bollinger_bands(rm, rstd):
    """Return upper and lower Bollinger Bands."""
    # TODO: Compute upper_band and lower_band
    upper_band = rstd * 2 + rm
    lower_band =  rm - rstd * 2
    return upper_band, lower_band


def test_run():
    # Read data
    dates = pd.date_range('2012-01-01', '2012-12-31')
    symbols = ['SPY']
    df = get_data(symbols, dates)

    # Compute Bollinger Bands
    # 1. Compute rolling mean
    rm_SPY = get_rolling_mean(df['SPY'], window=20)

    # 2. Compute rolling standard deviation
    rstd_SPY = get_rolling_std(df['SPY'], window=20)

    # 3. Compute upper and lower bands
    upper_band, lower_band = get_bollinger_bands(rm_SPY, rstd_SPY)

    # Plot raw SPY values, rolling mean and Bollinger Bands
    ax = df['SPY'].plot(title="Bollinger Bands", label='SPY')
    rm_SPY.plot(label='Rolling mean', ax=ax)
    upper_band.plot(label='upper band', ax=ax)
    lower_band.plot(label='lower band', ax=ax)

    # Add axis labels and legend
    ax.set_xlabel("Date")
    ax.set_ylabel("Price")
    ax.legend(loc='upper left')
    plt.show()


if __name__ == "__main__":
    test_run()
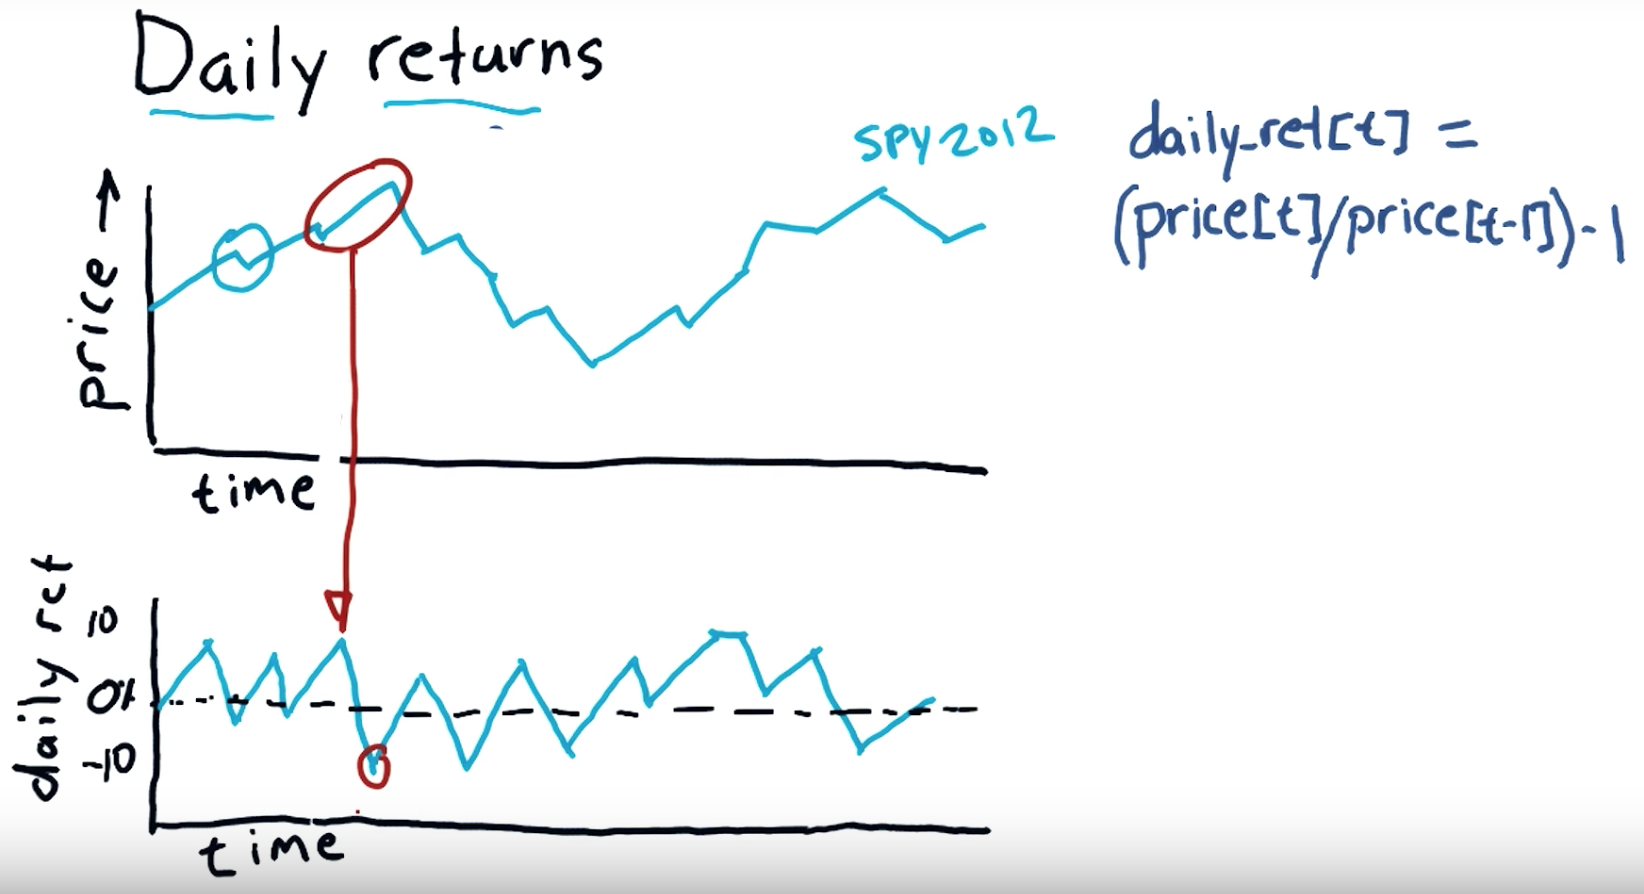
Daily return:
Subtract the previous day's closing price from the most recent day's closing price. In this example, subtract $35.50 from $36.75 to get $1.25. Divide your Step 4 result by the previous day's closing price to calculate the daily return. Multiply this result by 100 to convert it to a percentage.
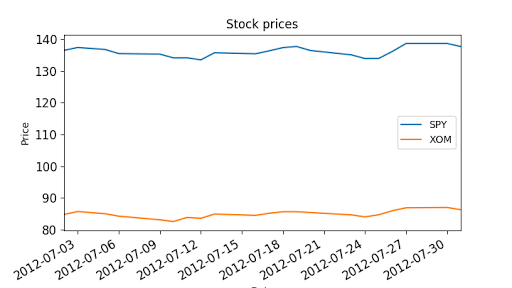
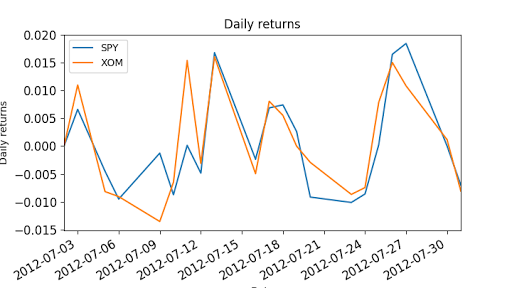
"""Compute daily returns."""

import os
import pandas as pd
import matplotlib.pyplot as plt

def symbol_to_path(symbol, base_dir="data"):
    """Return CSV file path given ticker symbol."""
    return os.path.join(base_dir, "{}.csv".format(str(symbol)))


def get_data(symbols, dates):
    """Read stock data (adjusted close) for given symbols from CSV files."""
    df = pd.DataFrame(index=dates)
    if 'SPY' not in symbols:  # add SPY for reference, if absent
        symbols.insert(0, 'SPY')

    for symbol in symbols:
        df_temp = pd.read_csv(symbol_to_path(symbol), index_col='Date',
                parse_dates=True, usecols=['Date', 'Adj Close'], na_values=['nan'])
        df_temp = df_temp.rename(columns={'Adj Close': symbol})
        df = df.join(df_temp)
        if symbol == 'SPY':  # drop dates SPY did not trade
            df = df.dropna(subset=["SPY"])

    return df


def plot_data(df, title="Stock prices", xlabel="Date", ylabel="Price"):
    """Plot stock prices with a custom title and meaningful axis labels."""
    ax = df.plot(title=title, fontsize=12)
    ax.set_xlabel(xlabel)
    ax.set_ylabel(ylabel)
    plt.show()


def compute_daily_returns(df):
    """Compute and return the daily return values."""
    # TODO: Your code here
    # Note: Returned DataFrame must have the same number of rows
    return df / df.shift(-1) -1


def test_run():
    # Read data
    dates = pd.date_range('2012-07-01', '2012-07-31')  # one month only
    symbols = ['SPY','XOM']
    df = get_data(symbols, dates)
    plot_data(df)

    # Compute daily returns
    daily_returns = compute_daily_returns(df)
    plot_data(daily_returns, title="Daily returns", ylabel="Daily returns")


if __name__ == "__main__":
    test_run()
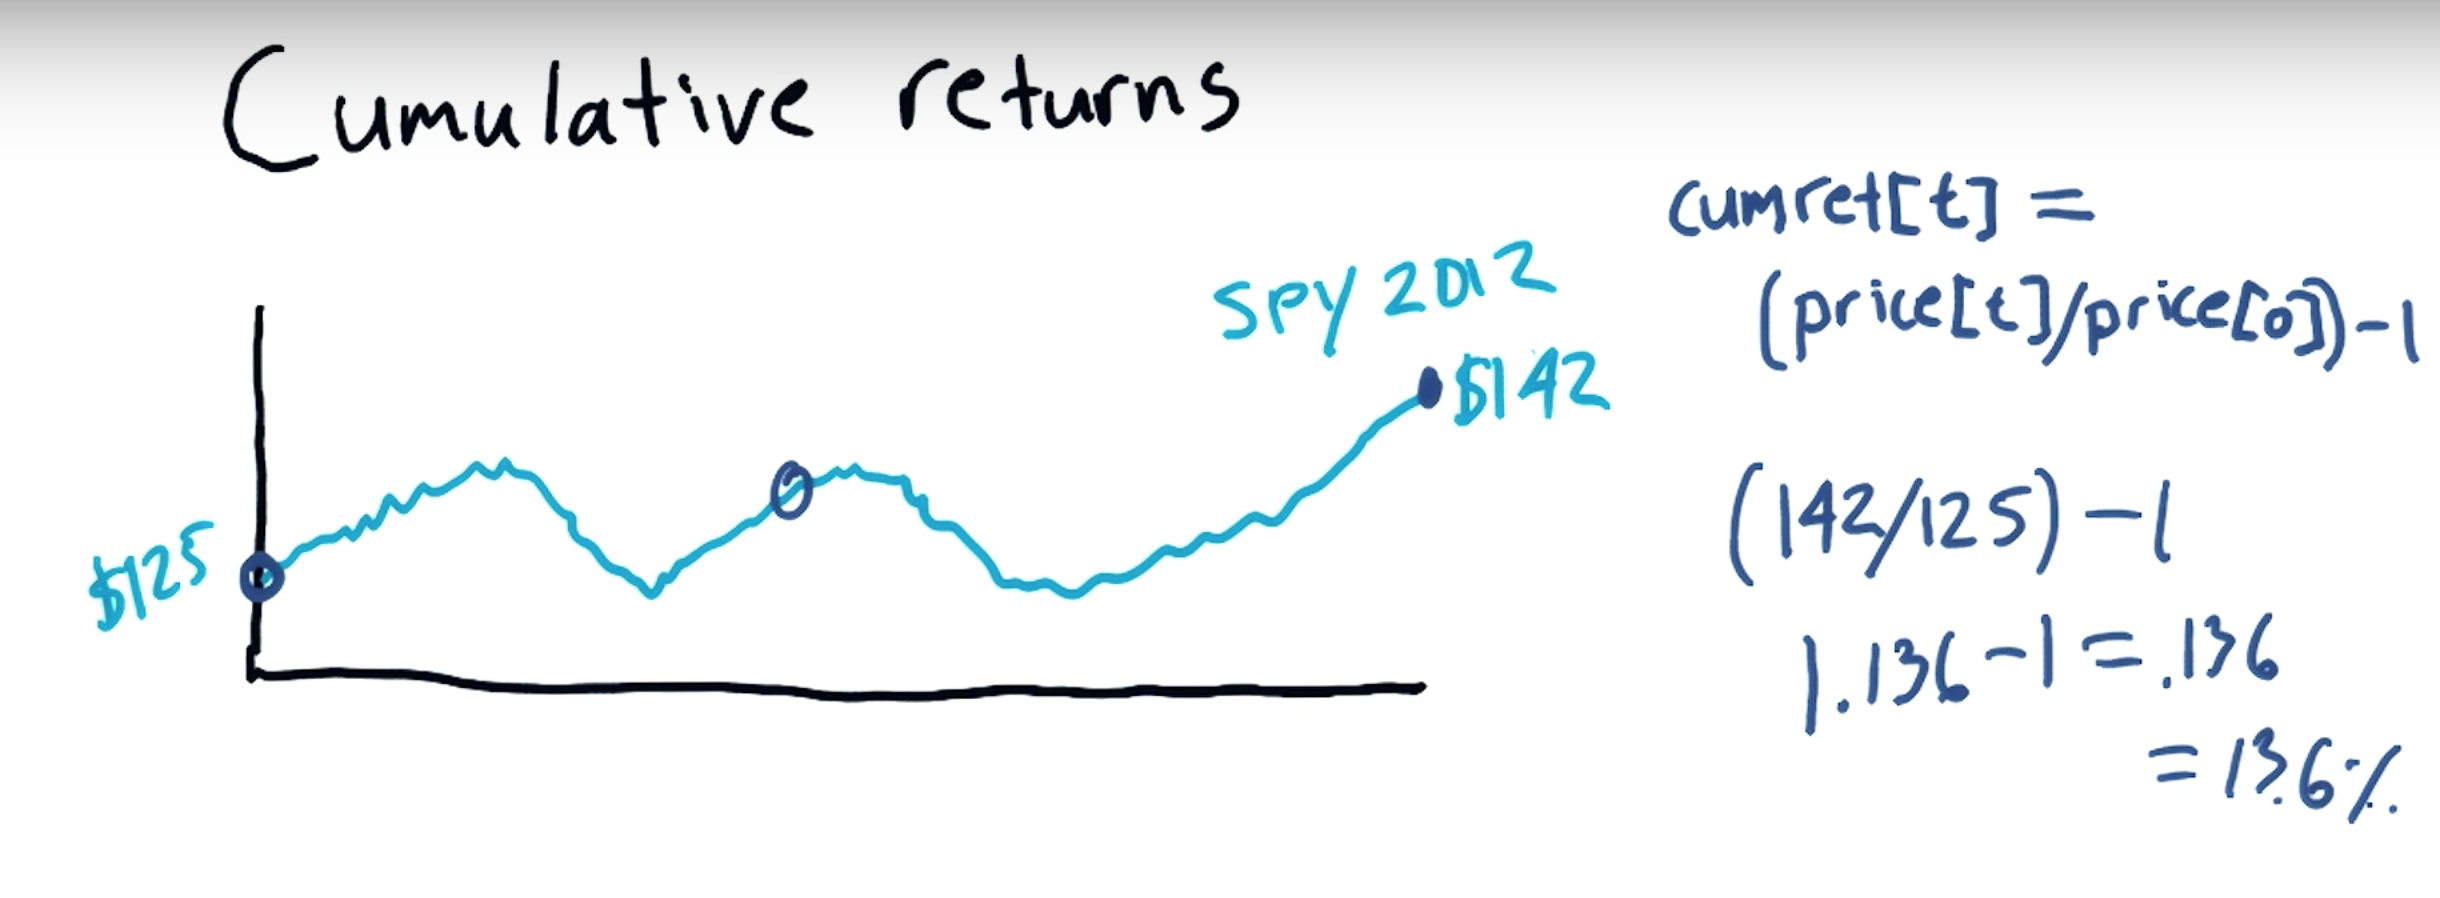
Cumulative return:
an investment relative to the principal amount invested over a specified amount of time. ... To calculate cumulative return, subtract the original price of the investment from the current price and divide that difference by the original price.
相关文章
- 【Python成长之路】python 基础篇 -- global/nonlocal关键字使用
- Python之调用WCF实现复杂参数序列化
- python之simplejson,Python版的简单、 快速、 可扩展 JSON 编码器/解码器
- [Javascript] Use an Array of Promises with a For Await Of Loop
- python: 安装DeOldify库:黑白图片上色(Python 3.7.15)
- 华为OD机试 - Linux发行版的数量(Java & JS & Python)
- Python: 爬虫入门-python爬虫入门教程(非常详细)
- Python:利用python语言绘制多个子图经典案例、代码实现之详细攻略
- 已解决DEPRECATION: Python 2.7 reached the end of its life on January 1st, 2020. Please upgrade your Pyt
- 已解决(Python安装报错)Visit python.org to download an earlier version of Python.
- 〖Python自动化办公篇㉑〗- python实现邮件自动化 - 定时发送邮件
- 【 华为OD机试 2023】 统一限载货物数最小值(C++ Java JavaScript Python)
- Python编程:MySQLdb模块的安装
- Python爬虫:PyExecJS在python中运行javascript代码
- python基础===Python 迭代器模块 itertools 简介
- Python 编译安装与打包
- Python kafka操作实例(kafka-python)
- python 面向对象
- Python开发入门到精通之11个案例讲透 Python 函数参数