
ETM and PTM
ETM:embedded Trace Macrocell
PTM:Program Flow Trace Macrocell
ETM-A7 macrocell提供Cortex-A7 MPcore的instruction和data的trace。

再与Cortex-A7的连接过程中,需要连接ETM interface和PMU 接口。
ETM interface包括:instruction address,branch,exception,data address,data value等。
ETM内部实现DFT logic,提供DFTSE和DFTRSTDISABLE信号。
ETM内部的block diagram:

PTM是基于Program Flow Trace(PFT)架构的,进行real-time instruction flow tracing的模块。
PTM会copy一份正在执行的code,然后只在一些program execution point进行trace,这样的点叫做waypoint。
Trace tools利用waypoint来follow program的execution。
一般的waypoint包括:
1)indirect branches,with target address and condition code;
2)direct branches with only the condition code;
3)exceptions
4)changes in processor security state
5)changes in processor instruction set state
可以自己config的point:
1)cycle count between traced waypoint
2)global system timestamps
3)target addresses for taken direct branches
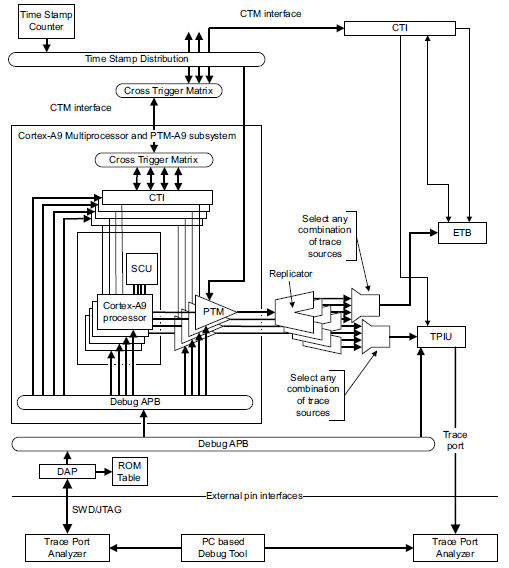
PTM集成中的架构图:
PTM模块内部的block diagram:
Processor input FIFO:buffers the output from processor trace interface until the execution of the
waypoint。

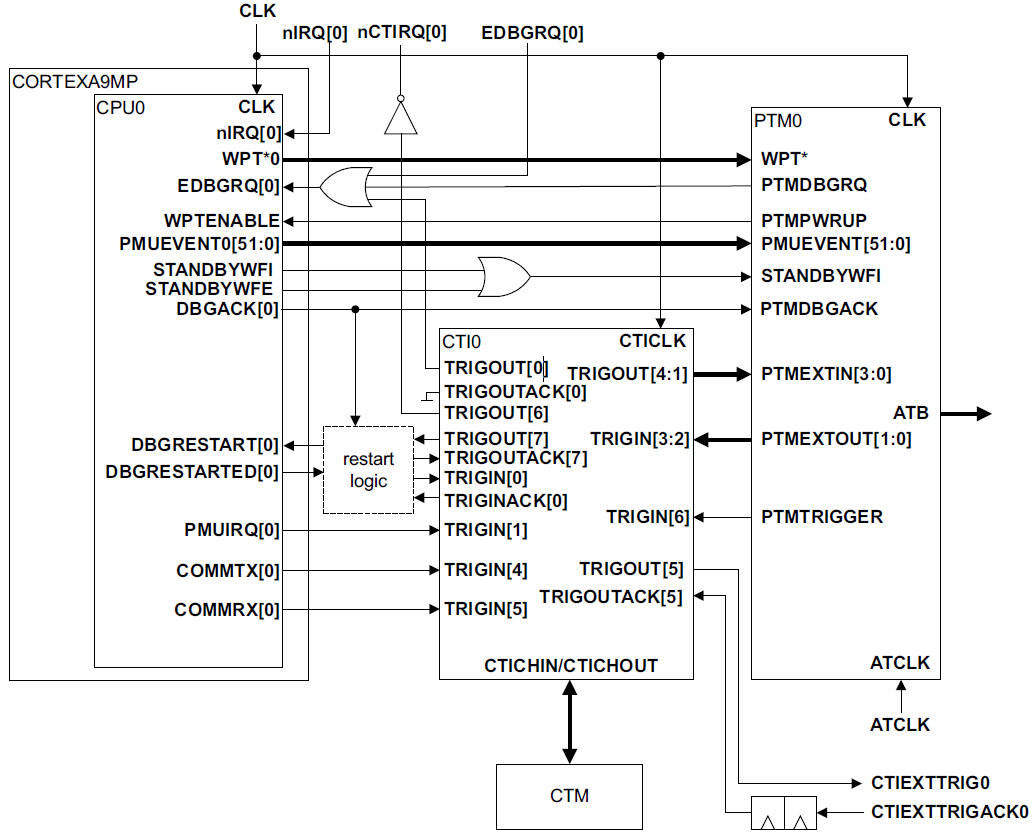
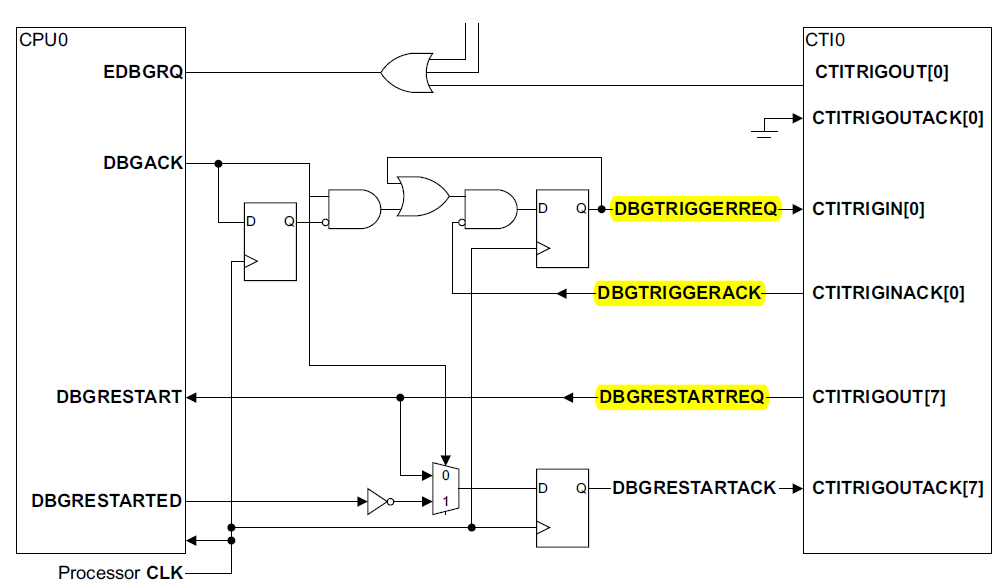
Processor与CTI和PTM的连接:
相关文章
- Sensory’s TrulyHandsfree and Arm’sCortex-M55
- 【Android】开发Android应用时对于Handler消息传递与缓存问题深入运用and理解
- 浅谈微博话题爬虫关键词 and or 语法搜索
- ORA-26819: string capture server for apply “string” and capture “string”encounters disabled or aborted propagation “string”. ORACLE 报错 故障修复 远程处理
- ORA-32315: REFRESH FAST of “string”.”string” unsupported after mixed DML and Direct Load ORACLE 报错 故障修复 远程处理
- ORA-03274: both ALLOCATE EXTENT and DEALLOCATE UNUSED options are specified ORACLE 报错 故障修复 远程处理
- Forking Redis: Exploring Benefits and Challenges(redisfork)
- CD and Explore the Amazing World of Linux(cd.linux)
- 微软:Windows 11不再支持Microsoft Stores for Business and Education
- Redis and Go: A Perfect Combination(redisgo)
- Linux TGZ: All You Need to Know About Tar and Gzip Compression!(linuxtgz)
- Exploring the Powerful Synergy of Linux and C Programming(Linux和c)
- Exploring the Benefits of Storing Data with MongoDB and XML(mongodbxml)