
qt之QCustomPlot动态时间轴更新曲线
Qt 动态 更新 曲线 时间轴
2023-09-27 14:29:08 时间
一、前言
使用qcustomplot进阶用法, 横坐标采用时间显示,纵坐标为数值当前值,主要实现的是横坐标点和时间对应,但不全部显示时间,只显示设定数量时间点,例如:曲线x长度10000,设置时间点7个,那么在坐标轴上会看见5-7个时间点,而不是密密麻麻的时间。详细见正文。
二、环境
window10
qt5.7
qcustomplot2.0
三、正文
头文件定义:
    QVector<double> time;
    QVector<double> y1_value;
void fw_data();//复位数据
void QCustomPlot_Init(QCustomPlot *CustomPlot);
void QCustomPlot_Updata1(QCustomPlot *CustomPlot);源文件核心代码:
//复位数据
void MainWindow_YL::fw_data()
{
    //开始采集前清空数据
    y1_value.clear();//清除y数据
    time.clear();
    for(int i=0;i<60;i++){
        y1_value.append(0);
        time.append(QDateTime::currentDateTime().addSecs(-60).addSecs(i).toTime_t());
    }
    //清空曲线显示
    QCustomPlot_Updata1(ui->customplot1);
}
void MainWindow_YL::QCustomPlot_Init(QCustomPlot *CustomPlot)
{
    //添加曲线
    CustomPlot->addGraph(CustomPlot->xAxis,CustomPlot->yAxis);//以左侧y轴为准
    QPen graphPen0;
    graphPen0.setWidthF(5);//曲线粗度
    graphPen0.setColor(QColor(55, 156, 212));//设置曲线颜色
    CustomPlot->graph(0)->setPen(graphPen0);//使用画笔绘制曲线
    CustomPlot->graph(0)->setName(QString(""));
    QLinearGradient plotGradient0;
    plotGradient0.setStart(0, 0);
    plotGradient0.setFinalStop(0, 350);
    plotGradient0.setColorAt(0, QColor(55, 156, 212, 255));//80, 80, 80
    plotGradient0.setColorAt(1, QColor(55, 156, 212, 10));//50, 50, 50
    CustomPlot->graph(0)->setBrush(plotGradient0); //设置曲线与x轴0点覆盖颜色

    //设置横坐标显示倍数
//    QSharedPointer<QCPAxisTickerPi> pITicker(new QCPAxisTickerPi());//QCPAxisTickerPi设置Pi刻度标签
//    CustomPlot->xAxis->setTicker(pITicker);
//    pITicker->setPiSymbol("");//设置数值后面π替换为*
//    pITicker->setFractionStyle(QCPAxisTickerPi::fsFloatingPoint);//设置小数部分显示float型
//    pITicker->setPiValue(1);//设置*表示的值 原代表π=3.14,先换为m_multiple//50ms传输一包,这里1秒就是20包,1/20=0.05

    //设置横坐标时间坐标轴 智能指针
    QSharedPointer<QCPAxisTickerDateTime> timer(new QCPAxisTickerDateTime);
    //timer->setDateTimeFormat("yyyy-MM-dd");    //设置时间格式
    timer->setDateTimeFormat("hh-mm-ss");    //设置时间格式
    timer->setTickCount(7);    //设置时间轴 一共几格
    QFont font;
    font.setFamily("黑体");
    font.setPixelSize(20);
    CustomPlot->xAxis->setTickLabelFont(font);
    CustomPlot->xAxis->setTickLabelRotation(0);//设置label 旋转角度30° 横着显示可能显示不全
    timer->setTickStepStrategy(QCPAxisTicker::tssMeetTickCount);//允许执行可读性较差的滴答步骤,从而有助于更接近所请求的滴答计数
    //设置坐标轴
    CustomPlot->xAxis->setTicker(timer);

    //设置坐标标题
//    CustomPlot->xAxis->setLabel(QString::fromUtf8("时间(s)"));
//    CustomPlot->yAxis->setLabel(QString::fromUtf8("plotname"));
    //设置坐标轴范围
    CustomPlot->xAxis->setRange(0,10);//设置x轴范围
    CustomPlot->yAxis->setRange(0,6);//设置y轴范围
    //设置网格虚线
    CustomPlot->xAxis->grid()->setVisible(false);
    CustomPlot->yAxis->grid()->setVisible(false);
    //设置风格颜色
//    QLinearGradient plotGradient;
//    plotGradient.setStart(0, 0);
//    plotGradient.setFinalStop(0, 350);
//    plotGradient.setColorAt(0, QColor(55, 156, 212, 255));//80, 80, 80
//    plotGradient.setColorAt(1, QColor(55, 156, 212, 100));//50, 50, 50
//    CustomPlot->setBackground(plotGradient);      // 设置背景颜色
    CustomPlot->setBackground(Qt::transparent);
    CustomPlot->setStyleSheet("background: transparent;");
    QLinearGradient axisRectGradient;
    axisRectGradient.setStart(0, 0);
    axisRectGradient.setFinalStop(0, 350);
    axisRectGradient.setColorAt(0, QColor(90, 160, 100, 50));
    axisRectGradient.setColorAt(1, QColor(90, 160, 100, 50));
    CustomPlot->axisRect()->setBackground(axisRectGradient);   // 设置QCPAxisRect背景颜色
    CustomPlot->xAxis->setBasePen(QPen(Qt::gray,2));//设置x轴坐标轴颜色
    CustomPlot->yAxis->setBasePen(QPen(Qt::gray,2));//设置y轴坐标轴颜色//black
    CustomPlot->xAxis->setTickPen(QPen(Qt::gray, 2));  // 轴刻度线的画笔
    CustomPlot->yAxis->setTickPen(QPen(Qt::gray,2));//black
    CustomPlot->xAxis->setSubTickPen(QPen(Qt::gray, 2)); // 轴子刻度线的画笔
    CustomPlot->yAxis->setSubTickPen(QPen(Qt::gray,2));//black
    CustomPlot->xAxis->setTickLabelColor(QColor(55, 156, 212));//设置x轴坐标颜色
    CustomPlot->yAxis->setTickLabelColor(QColor(55, 156, 212));//设置y轴坐标颜色
    CustomPlot->xAxis->setLabelColor(Qt::gray);//设置x轴名称颜色
    CustomPlot->yAxis->setLabelColor(Qt::gray);//设置y轴名称颜色
    //设置曲线名称显示
    CustomPlot->legend->setBrush(QColor(0, 0, 0, 0));//设置图例提示背景色(曲线名称背景色)
    CustomPlot->legend->setVisible(false);//设置曲线名称不可见
    CustomPlot->legend->setTextColor(Qt::white);//black

    CustomPlot->yAxis->setVisible(false);//设置y轴不可见

    CustomPlot->replot();//重绘制
}
//刷新曲线1
void MainWindow_YL::QCustomPlot_Updata1(QCustomPlot *CustomPlot)
{
    //设置坐标轴范围
    CustomPlot->xAxis->setRange(time.at(0),time.at(time.size()-1));//设置y轴范围
    //设置y轴范围,y轴不可见,但需要设置曲线高度显示范围
    if(ui->pushButton4->isChecked()){
        CustomPlot->yAxis->setRange(0,0.7);
    }
    else if(ui->pushButton5->isChecked()){
        CustomPlot->yAxis->setRange(0,2.5);
    }
    else if(ui->pushButton6->isChecked()){
        CustomPlot->yAxis->setRange(0,6);
    }
    CustomPlot->graph(0)->setData(time,y1_value);//设置数据
//    CustomPlot->yAxis->rescale(true);//设置Y轴坐标系 自动缩放以正常显示所有的数据
    CustomPlot->graph(0)->rescaleAxes(true);//根据图像最高点最低点自动缩放坐标轴
    CustomPlot->replot();//重绘制
}
本例子中y轴被我隐藏,但是在刷新曲线函数中可以看见,在我选择不同的控件时,更新的y轴范围不同,更适合显示全部曲线,

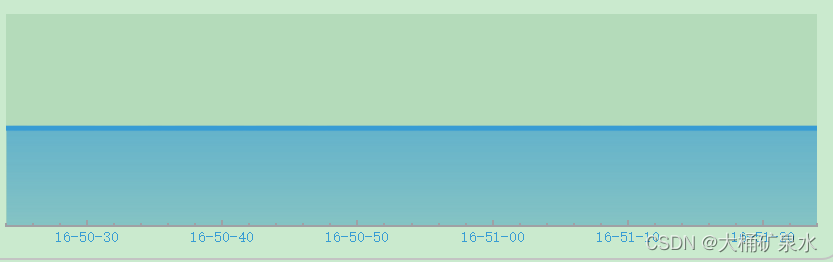
如图可见曲线横坐标显示为时间,在程序中这个曲线范围是60个点,定时1秒采集1次数据,采集数据时间和坐标轴时间对应。
初始化函数:
    QCustomPlot_Init(ui->customplot1);
    fw_data();//初始化执行复位数据
执行一次初始化函数,在复位一次数据。
复位数据方式是清空缓存数据,在更新空数据进去,这样曲线看着就不是一点一点挤小,在平移了。
初始化增加:
    connect(ui->pushButton4,&QPushButton::clicked,[=](){//选中对应传感器
        gaugepan[0]->setRingColor(QColor(54, 192, 254));
        gaugepan[1]->setRingColor(QColor(180, 180, 180));
        gaugepan[2]->setRingColor(QColor(180, 180, 180));
        gaugepan[1]->setValue(0);//未选中数值清零
        gaugepan[2]->setValue(0);//未选中数值清零
        ui->pushButton4->setChecked(true);
        ui->pushButton5->setChecked(false);
        ui->pushButton6->setChecked(false);
        fw_data();//曲线数据复位
    });
    connect(ui->pushButton5,&QPushButton::clicked,[=](){//选中对应传感器
        gaugepan[0]->setRingColor(QColor(180, 180, 180));
        gaugepan[1]->setRingColor(QColor(54, 192, 254));
        gaugepan[2]->setRingColor(QColor(180, 180, 180));
        gaugepan[0]->setValue(0);//未选中数值清零
        gaugepan[2]->setValue(0);//未选中数值清零
        ui->pushButton4->setChecked(false);
        ui->pushButton5->setChecked(true);
        ui->pushButton6->setChecked(false);
        fw_data();//曲线数据复位
    });
    connect(ui->pushButton6,&QPushButton::clicked,[=](){//选中对应传感器
        gaugepan[0]->setRingColor(QColor(180, 180, 180));
        gaugepan[1]->setRingColor(QColor(180, 180, 180));
        gaugepan[2]->setRingColor(QColor(54, 192, 254));
        gaugepan[0]->setValue(0);//未选中数值清零
        gaugepan[1]->setValue(0);//未选中数值清零
        ui->pushButton4->setChecked(false);
        ui->pushButton5->setChecked(false);
        ui->pushButton6->setChecked(true);
        fw_data();//曲线数据复位
    });
    ui->pushButton4->click();//默认选择第一个
此部分程序就是看一下是如何操作每个按键点击之后清空数据的。
最终效果如下:
四、结语
相关文章
- Qt之图形视图框架
- Qt之QNetworkInterface
- 使用Qt连接MySql并创建表号、写入数据、删除数据
- 【Qt开发】QTextEdit 外观属性设置
- 【Qt开发】QTableWidget设置根据内容调整列宽和行高
- 【Linux开发】【Qt开发】ARM QT移植详细步骤教程
- Qt学习笔记 QMessageBox
- PyQt(Python+Qt)学习随笔:QTableWidget设置项的setItem方法
- PyQt(Python+Qt)学习随笔:QCommandLinkButton的特征及用途
- PyQt(Python+Qt)学习随笔:复选框checkBox的tristate属性
- PyQt(Python+Qt)学习随笔:Qt Designer组件属性编辑界面中对话窗QDialog的sizeGripEnabled属性
- 27.QT-QProgressBar动态实现多彩进度条(详解)
- 21.QT-QTreeWidget,QTabWidget
- qt之QCustomPlot动态更改曲线数量,单光标查看数值,选中曲线单独显示查看趋势
- qt widgets chartview曲线图绘制(解决动态刷新内存过大问题)
- Qt应用程序主窗口之二:拖放操作与打印文档
- QT Desinger设计窗体应用程序框架