
kylin-BI工具-tableau9
Tableau 9.x has been released a while, there are many users are asking about support this version with Apache Kylin. With updated Kylin ODBC Driver, now user could interactive with Kylin service through Tableau 9.x.
Apache Kylin currently doesn’t support query on raw data yet, some queries might fail and cause some exceptions in application. Patch KYLIN-1075 is recommended to get better look of query result.
For Tableau 8.x UserPlease refer to Kylin and Tableau Tutorial for detail guide.
Install Kylin ODBC DriverRefer to this guide: Kylin ODBC Driver Tutorial.
Please make sure to download and install Kylin ODBC Driver v1.2. If you already installed ODBC Driver in your system, please uninstall it first.
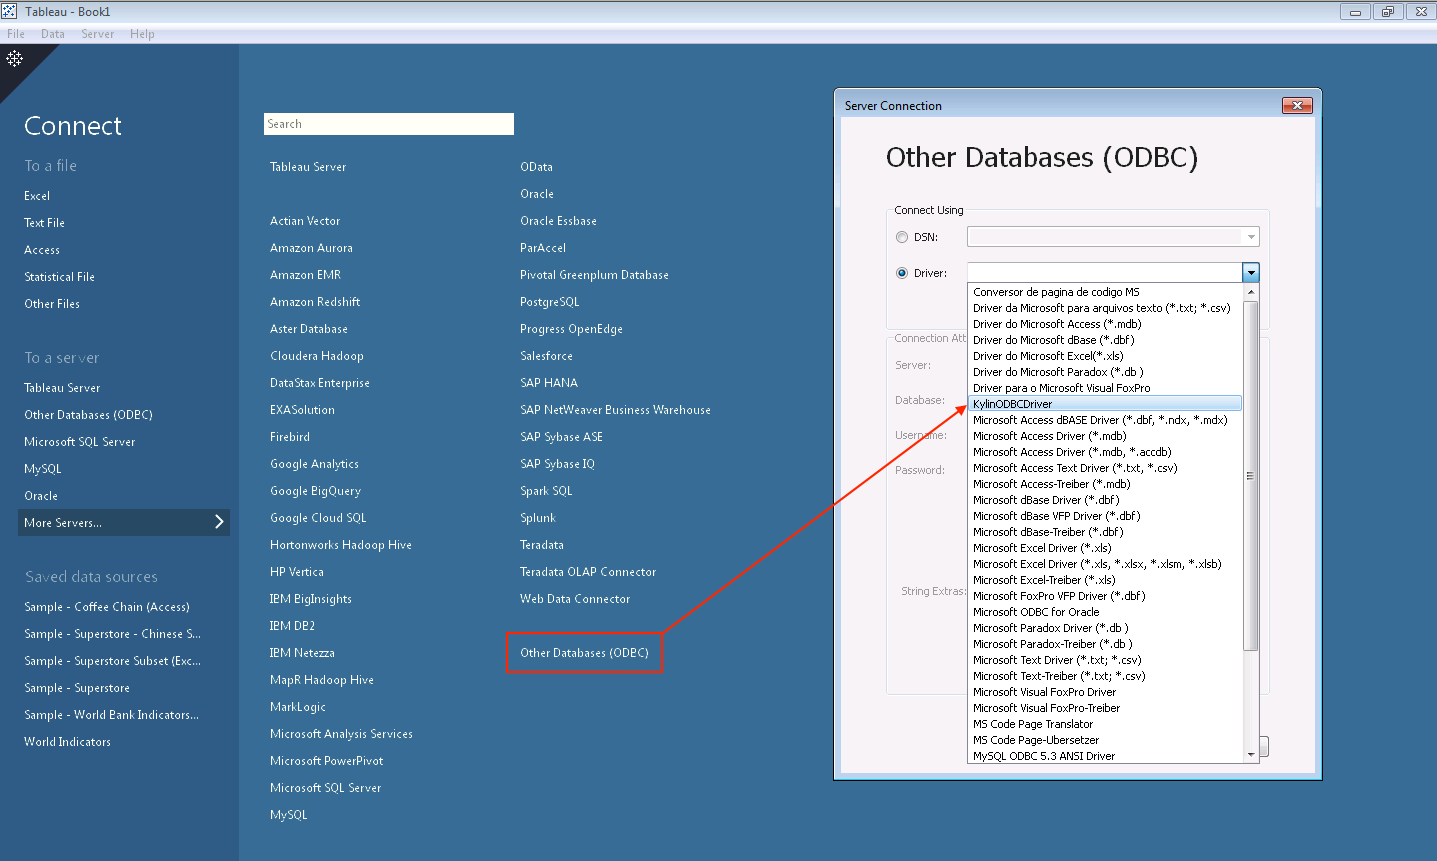
Connect Using Driver: Start Tableau 9.1 desktop, click
Other Database(ODBC) in the left panel and choose KylinODBCDriver in the pop-up window.
Provide your Sever location, credentials and project. Clicking
Connect button, you can get the list of projects that you have permission to access, see details at
Kylin Cube Permission Grant Tutorial.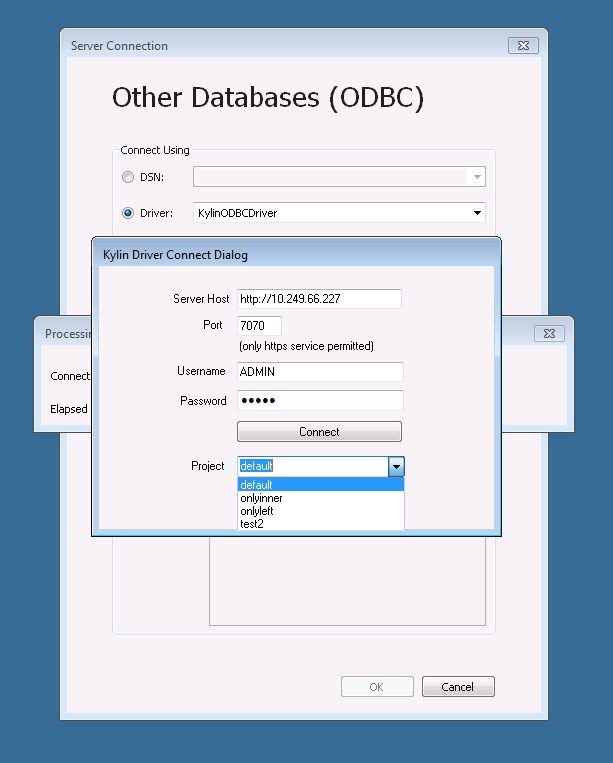
In left panel, select defaultCatalog as Database, click
Search button in Table search box, and all tables get listed. With drag and drop to the right region, tables will become data source. Make sure JOINs are configured correctly.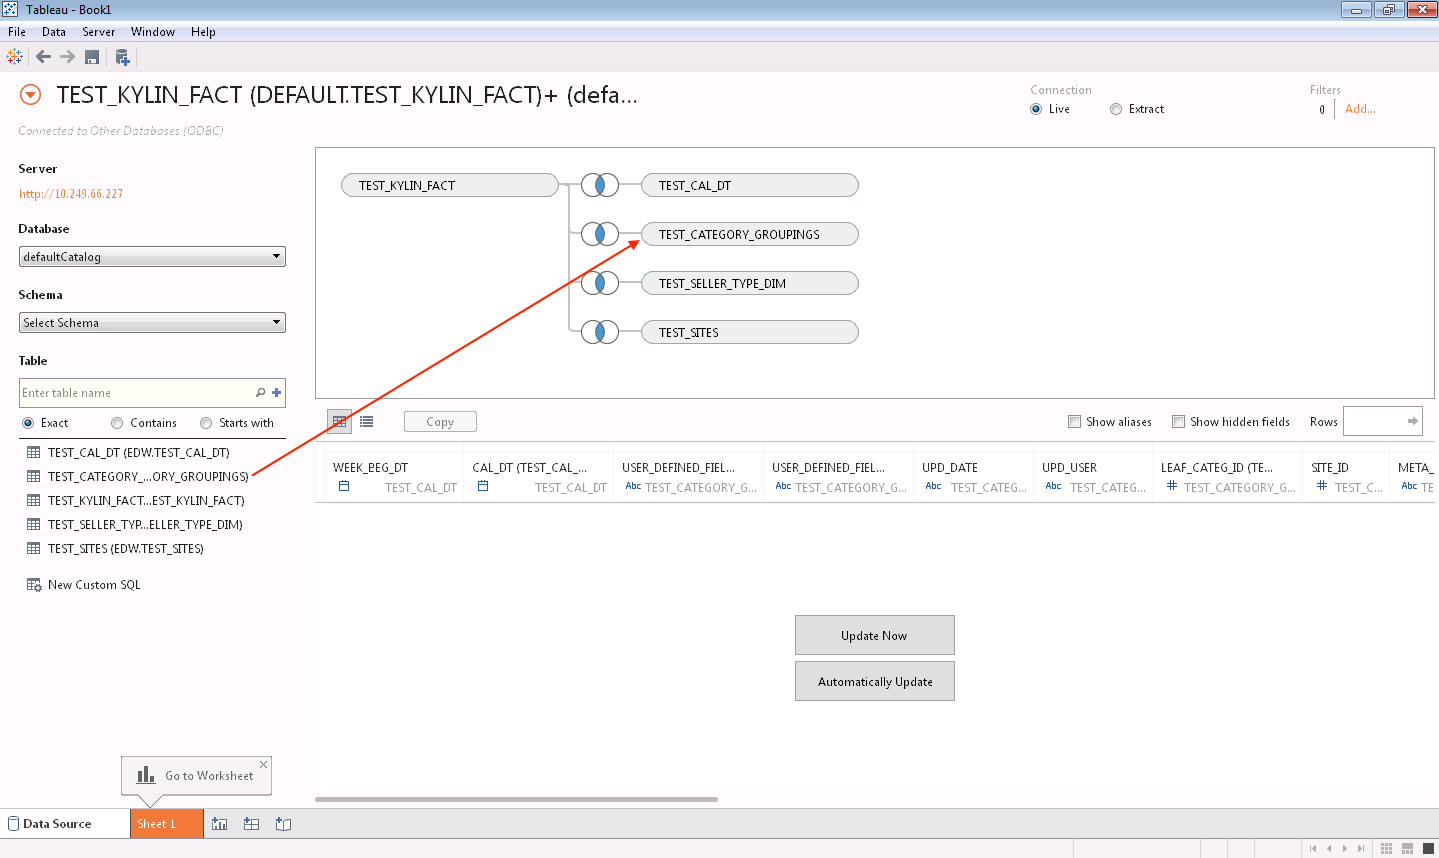
There are two types of Connection, choose the
Live option to make sure using Connect Live mode.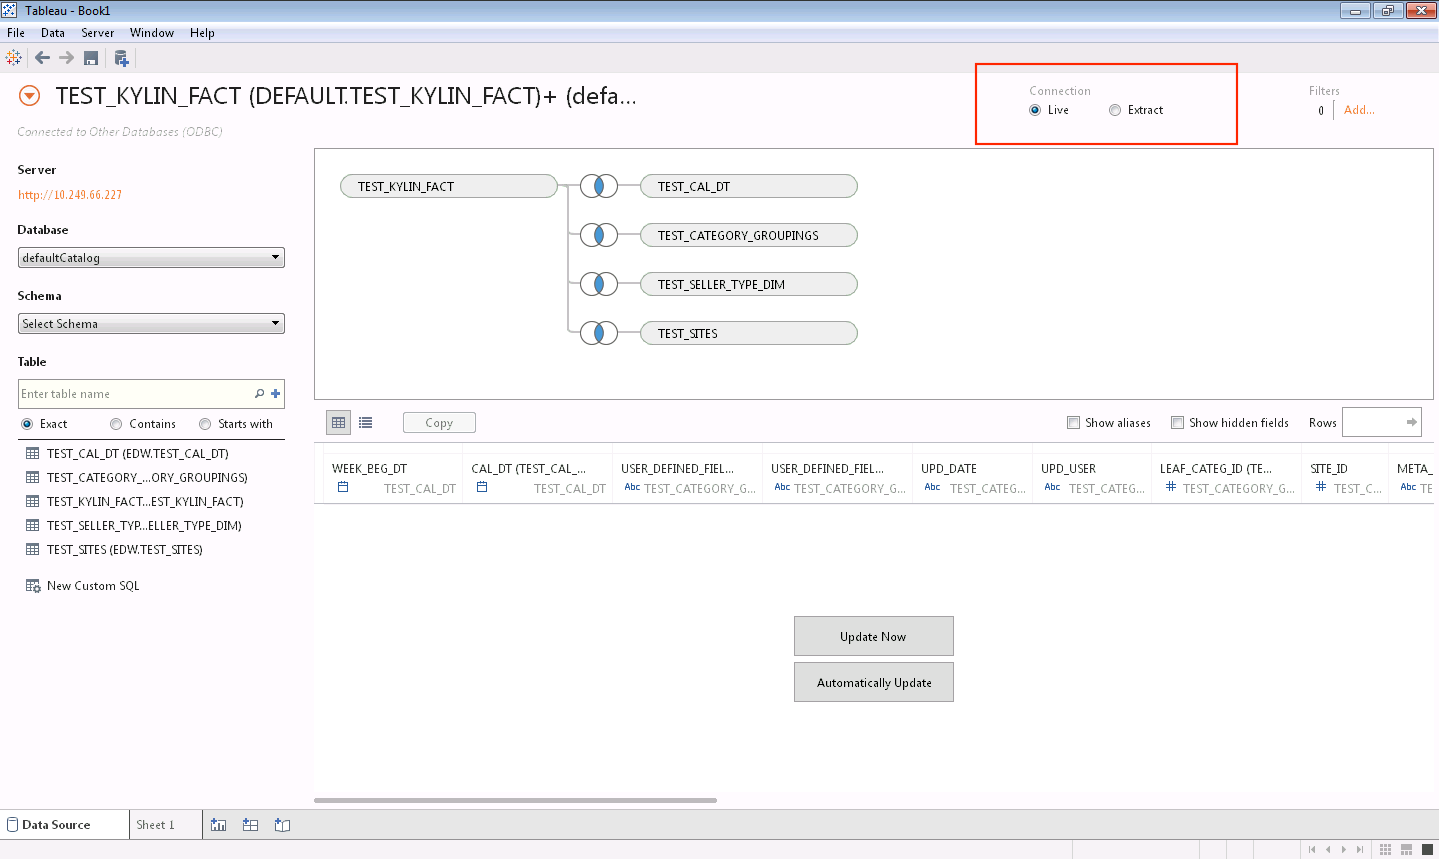
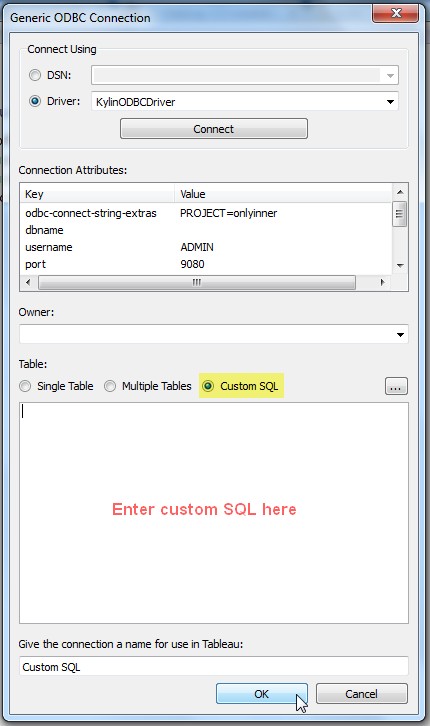
To use customized SQL, click New Custom SQL in left panel and type SQL statement in pop-up dialog.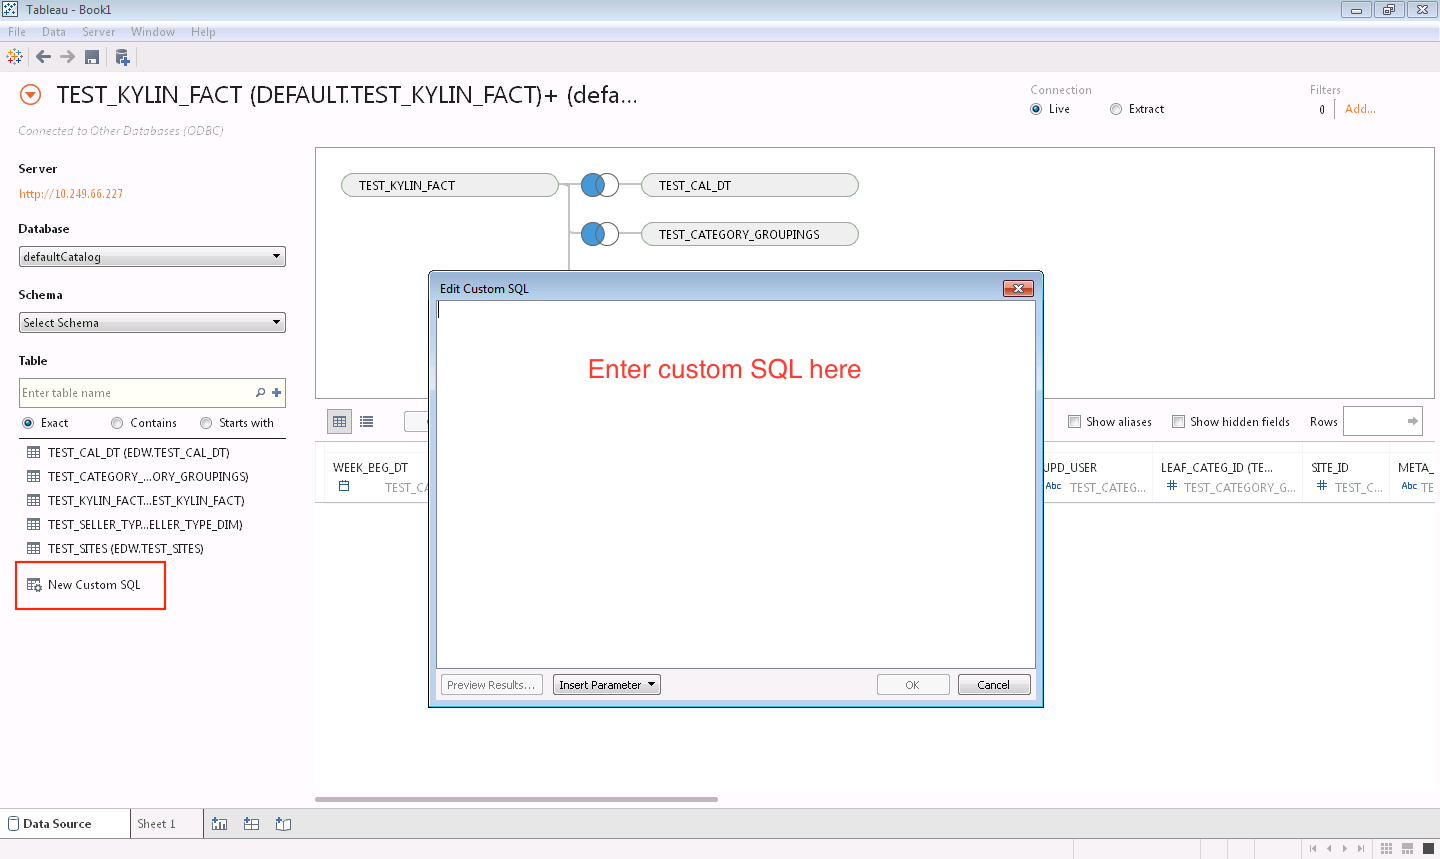
Now you can start to enjou analyzing with Tableau 9.1.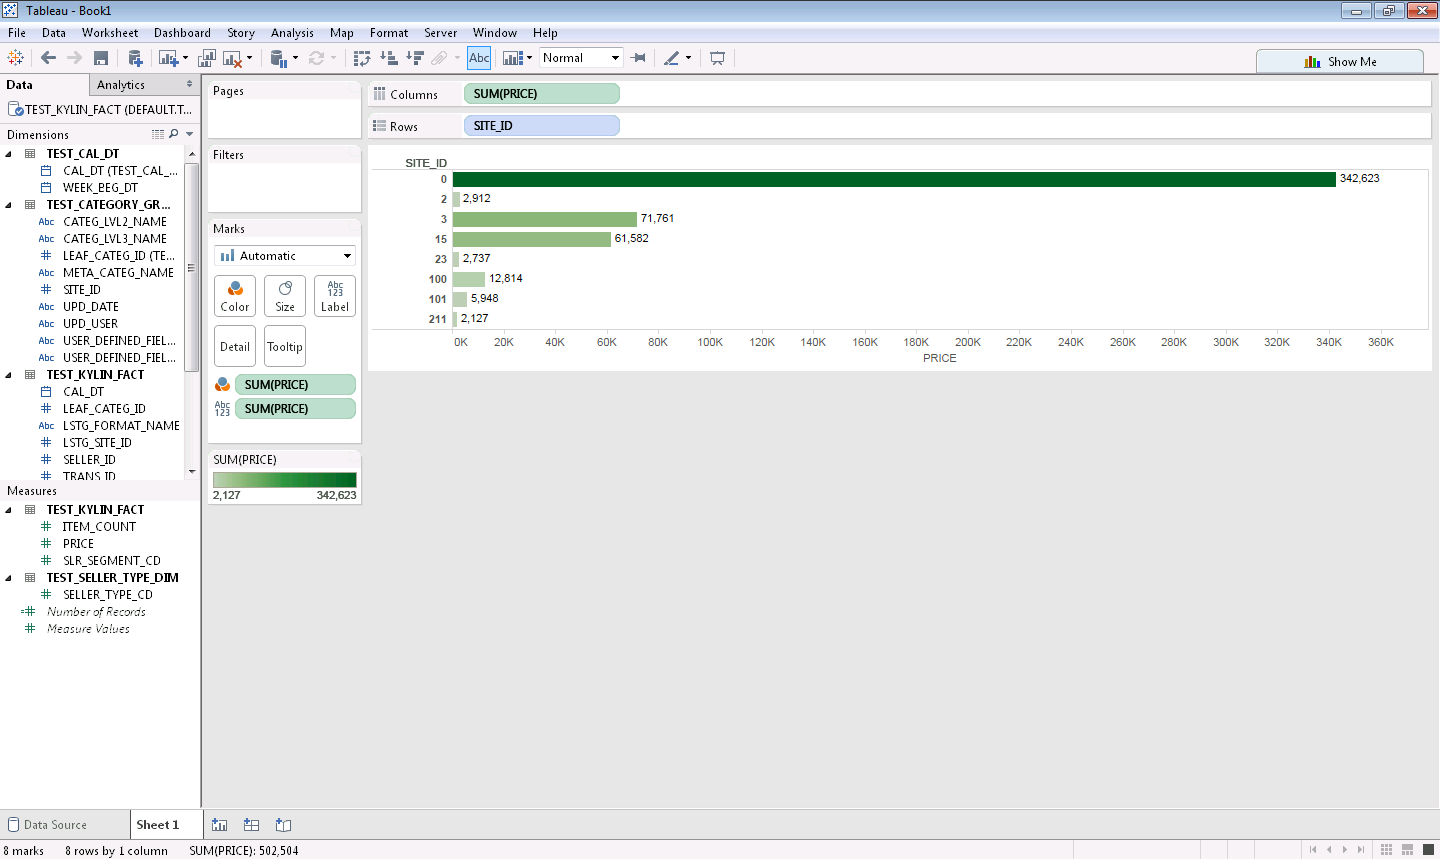
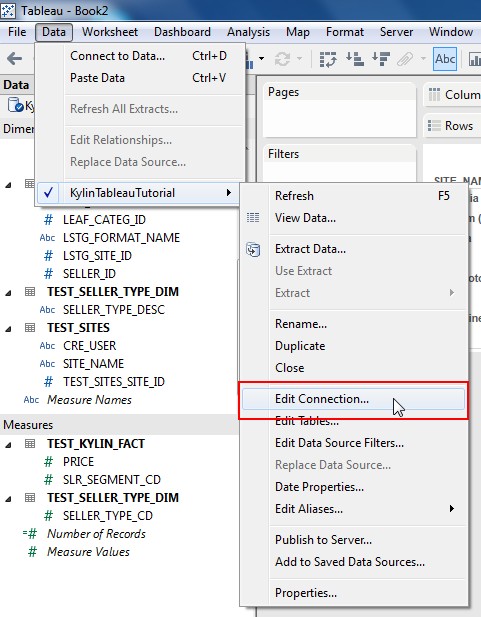
If you want to publish local dashboard to a Tableau Server, just expand
Server menu and select Publish Workbook.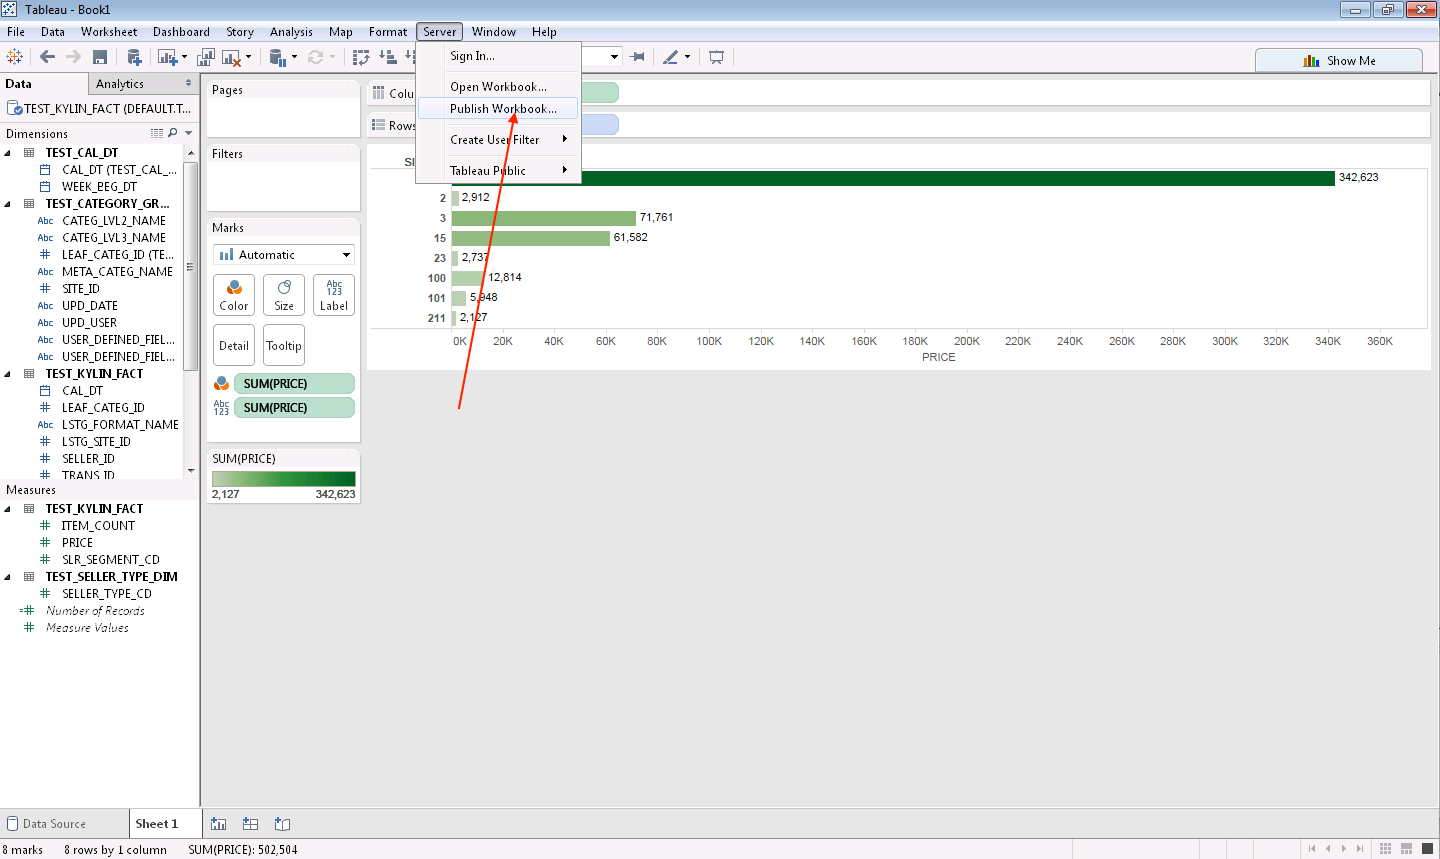
There are some limitations of Kylin ODBC driver with Tableau, please read carefully this instruction before you try it.
Only support “managed” analysis path, Kylin engine will raise exception for unexpected dimension or metric Please always select Fact Table first, then add lookup tables with correct join condition (defined join type in cube) Do not try to join between fact tables or lookup tables; You can try to use high cardinality dimensions like seller id as Tableau Filter, but the engine will only return limited seller id in Tableau’s filter now.For Tableau 9.x User
Please refer to Tableau 9.x Tutorial for detail guide.
Step 1. Install Kylin ODBC DriverRefer to this guide: Kylin ODBC Driver Tutorial.
Step 2. Connect to Kylin ServerWe recommended to use Connect Using Driver instead of Using DSN.
Connect Using Driver: Select “Other Database(ODBC)” in the left panel and choose KylinODBCDriver in the pop-up window.

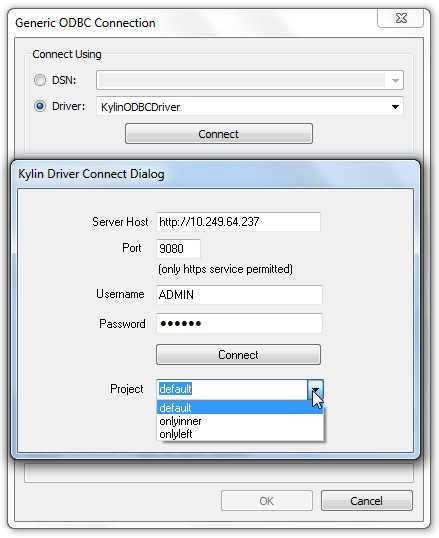
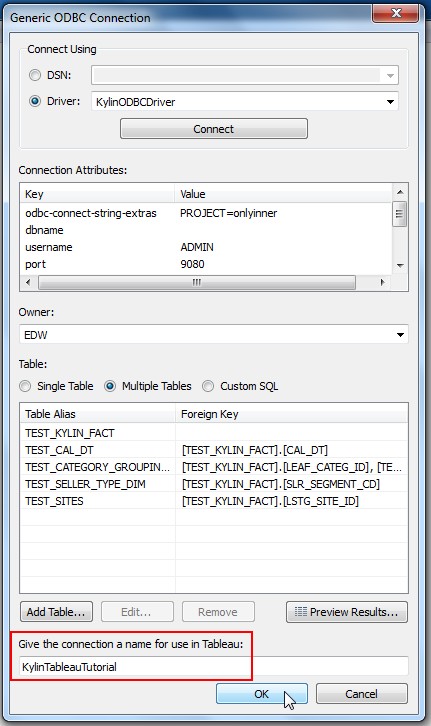
Enter your Sever location and credentials: server host, port, username and password.
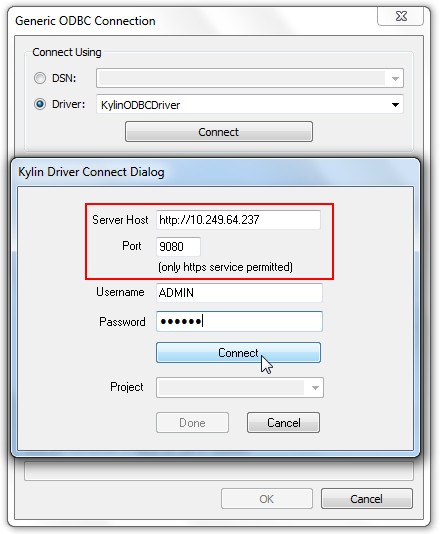
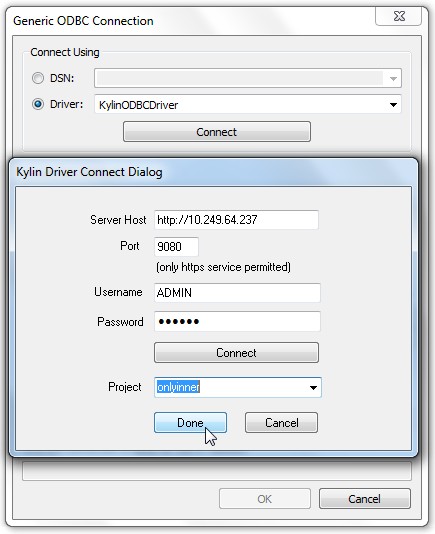
Click “Connect” to get the list of projects that you have permission to access. See details about permission in Kylin Cube Permission Grant Tutorial. Then choose the project you want to connect in the drop down list.
Click “Done” to complete the connection.
Limitation
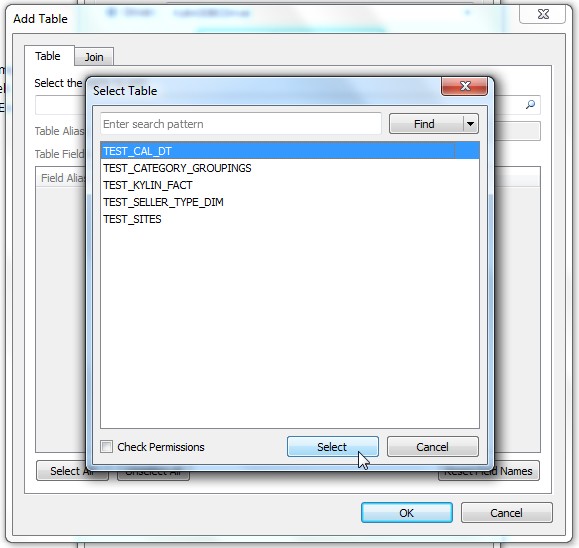
Must select FACT table first Do not support select from lookup table only The join condition must match within cube definitionSelect Multiple Tables.
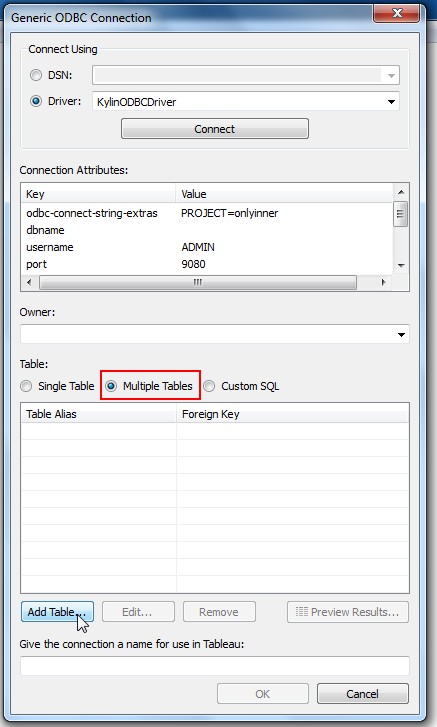
Then click Add Table... to add a fact table.
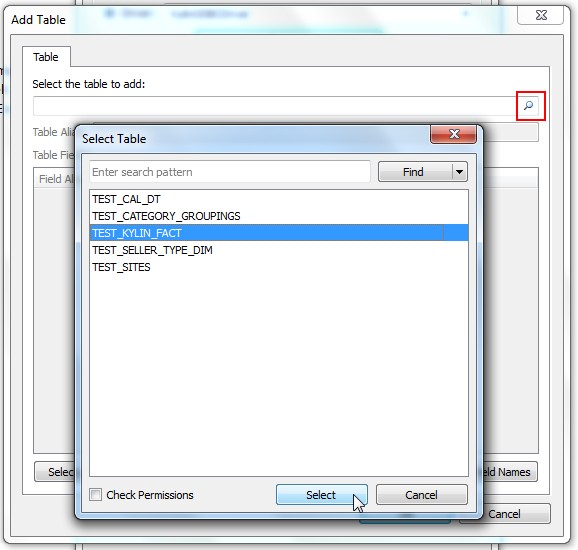
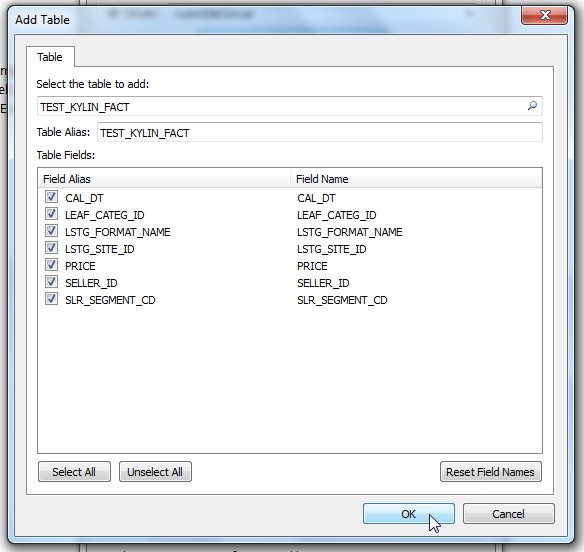
Select Look-up Table
Click Add Table... to add a look-up table.
Set up the join clause carefully.

Keep add tables through click Add Table... until all the look-up tables have been added properly. Give the connection a name for use in Tableau.
Using Connect Live
There are three types of Data Connection. Choose the Connect Live option.
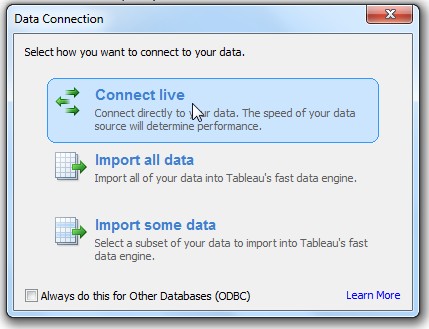
Then you can enjoy analyzing with Tableau.

Add additional look-up Tables
Click Data in the top menu bar, select Edit Tables... to update the look-up table information.
To use customized SQL resembles using Single Table/Multiple Tables, except that you just need to paste your SQL in Custom SQL tab and take the same instruction as above.
Suppose you have finished making a dashboard with Tableau, you can publish it to Tableau Server.
Click Server in the top menu bar, select
Publish Workbook....

Then sign in your Tableau Server and prepare to publish.
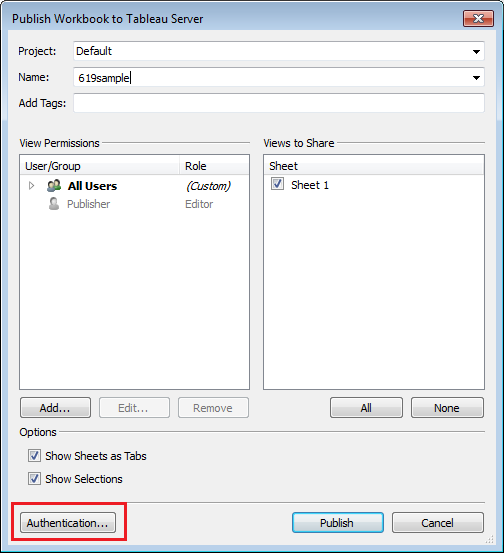
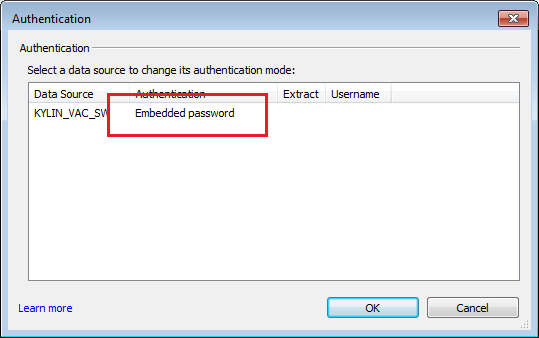
If you’re Using Driver Connect instead of DSN connect, you’ll need to additionally embed your password in. Click the Authentication button at left bottom and select Embedded Password. Click Publish and you will see the result.
Hide Table name in Tableau
Tableau will display columns be grouped by source table name, but user may want to organize columns with different structure. Using “Group by Folder” in Tableau and Create Folders to group different columns.
现在啥软件都有开源,BI 呢? 开源现在很流行,从系统级到应用层面,都有各类开源软件供开发者使用,比如 Linux Android Mysql PostgreSQL Hadoop Apache Tamcat Birt等,在国内都很流行
自助式商业智能 (BI) 工具 本文研究全球及中国市场自助式商业智能 (BI) 工具现状及未来发展趋势,侧重分析全球及中国市场的主要企业,同时对比北美、欧洲、中国、日本、东南亚和印度等地区的现状及未来发展趋势
云商业智能 (BI) 工具 本文研究全球及中国市场云商业智能 (BI) 工具现状及未来发展趋势,侧重分析全球及中国市场的主要企业,同时对比北美、欧洲、中国、日本、东南亚和印度等地区的现状及未来发展趋势
你要的BI分析工具都在这里了 使用过交互式分析的小伙伴们都了解,交互式分析是兼容PosgreSQL生态,这就意味着,能对接PostgreSQL的BI工具都能对接交互式分析了,但面对市面上让人眼花缭乱的BI工具,到底该从哪些角度选择适合业务的分析工具,选择了又怎么连接交互式分析呢?
当移动数据分析需求遇到Quick BI 我叫洞幺,是一名大型婚恋网站“我在这等你”的资深老员工,虽然在公司五六年,还处于一线干活。“我在这等你”成立15年,目前积累注册用户高达2亿多,在我们网站成功牵手的用户达2千多万。目前我们的公司在CEO的英名带领下,稳步发展着。
Quick BI 支持多种数据源进行多维分析 随着互联网的高速发展,数据量爆发式增长的同时,数据的存储形式也开始呈现出多样性,有结构化存储,如 Mysql, Oracle, SQLServer 等,半结构化甚至非结构化存储,如HBase,OSS 等。
数据进入到数据库中,查询只能看到一行行的数据,最好是可以通过图形的方式将数据形象化的展示出来,通过图形进行组合分析,仪表分析,地图分析,多维分析等等,更加详细的通过图形展示数据,展示规律,展示分析!