
Memory Analyzer tool(MAT)分析内存泄漏---理解Retained Heap、Shallow Heap、GC Root
Shallow Heap Size
指对象自身所占用的内存大小,不包含其引用的对象所占的内存大小。
1、数组类型
数组元素对象所占内存的大小总和。
2、非数组类型
对象与它所有的成员变量大小的总和。当然这里面还会包括一些Java语言特性的数据存储单元。
Retained Heap Size
前对象大小+当前对象可直接或间接引用到的对象的大小总和。
(间接引用的含义:A->B->C, C就是间接引用)
换句话说,Retained Size就是当前对象被GC后,从Heap上总共能释放掉的内存。
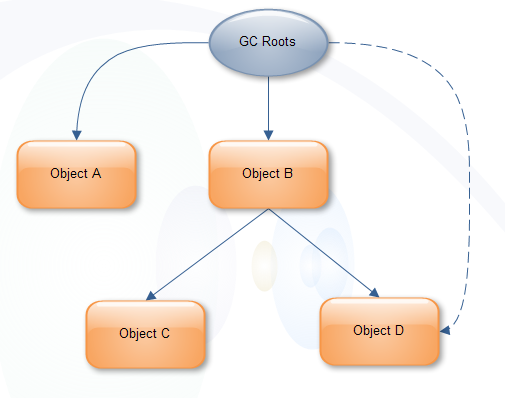
不过,释放的时候还要排除被GC Roots直接或间接引用的对象。他们暂时不会被被当做Garbage。GC Roots直接引用了A和B两个对象。
A对象的Retained Size=A对象的Shallow Size
B对象的Retained Size=B对象的Shallow Size + C对象的Shallow Size这里不包括D对象,因为D对象被GC Roots直接引用。
如果GC Roots不引用D对象呢?

GC Roots
The so-called GC (Garbage Collector) roots are objects special for garbage collector. Garbage collector collects those objects that are not GC roots and are not accessible by references from GC roots.
There are several kinds of GC roots. One object can belong to more than one kind of root. The root kinds are:
- Class - class loaded by system class loader. Such classes can never be unloaded. They can hold objects via static fields. Please note that classes loaded by custom class loaders are not roots, unless corresponding instances of
java.lang.Classhappen to be roots of other kind(s).- Thread - live thread
- Stack Local - local variable or parameter of Java method
- JNI Local - local variable or parameter of JNI method
- JNI Global - global JNI reference
- Monitor Used - objects used as a monitor for synchronization
- Held by JVM - objects held from garbage collection by JVM for its purposes. Actually the list of such objects depends on JVM implementation. Possible known cases are: the system class loader, a few important exception classes which the JVM knows about, a few pre-allocated objects for exception handling, and custom class loaders when they are in the process of loading classes.Unfortunately, JVM provides absolutely no additional detail for such objects. Thus it is up to the analyst to decide to which case a certain "Held by JVM" belongs.
If an object is a root, it is specially marked in all views showing individual objects. For example, the following picture shows a fragment ofpaths view:
http://www.yourkit.com/docs/90/help/gc_roots.jsp
相关文章
- 文件操作方法大全以及文件打开的其他一些模式sys.stdout.write()就是标准输出到你当前的屏幕 sys.stdout.flush()把内存立即显示到您当前的屏幕
- Text to image论文精读Adma-GAN:用于文本到图像生成的属性驱动内存增强型GAN Attribute-Driven Memory Augmented GANs for T2I
- Android内存泄漏的八种可能
- Android应用内存泄漏的定位、分析与解决策略
- ps_mem:一个用于精确报告Linux核心内存用量的简单Python脚本
- Spring Cloud 开发内存占用过高,咋解决?
- MySQL系列:innodb源代码分析之内存管理
- 转: Linux与JVM的内存关系分析
- HBase最佳实践-内存规划
- [日常工作] 并行计算引发Microsoft.jscript.ni.dll的内存溢出问题的分析解决. .net framework 的版本说明
- Go坑:time.After可能导致的内存泄露问题分析
- Android内存泄漏的检测流程、捕捉以及分析
- arthas内存也可以分析 -线程死锁 -cpu高
- Java8内存模型 永久代(PermGen)和元空间(Metaspace)
- 2022-07-22 mysql/stonedb并行hashJoin内存占用分析
- 对插入排序以及内存管理的一些分析
- jmap 导出 tomcat 内存快照分析
- Windows Server中的 WINS 服务器远程内存损坏漏洞分析
- 【Python line_profiler & memory_profiler】分析每一行代码的耗时及内存占用情况
- 【Android】Eclipse Memory Analyzer 进行堆内存溢出分析
- Android开发——内存优化 图片处理
- Android 性能优化之内存优化与泄漏分析工具LeakCanary
- 魔鬼的梦魇—验证IE中的JS内存泄露模式(一)
- windbg调试- 内存泄露(不断上升)
- Android中使用Thread造成内存泄露的分析和解决
- 宋宝华:Linux内核中用GFP_ATOMIC申请内存究竟意味着什么?