
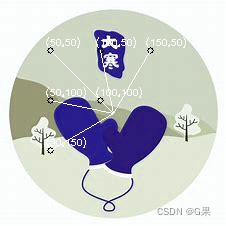
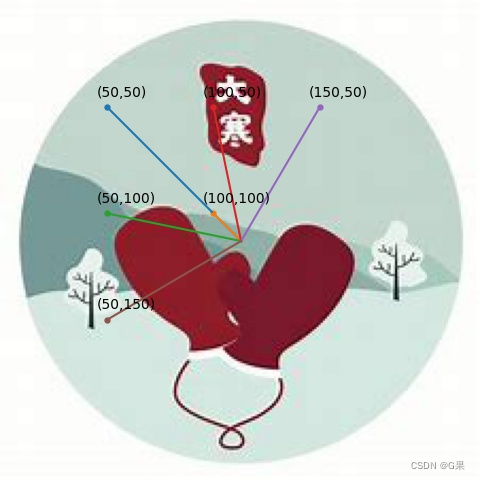
cv2 库和 plt 库在原图上画圆点和连线
cv2 连线 plt
2023-09-27 14:20:15 时间
原图RGB 尺寸:[226,226,3]

圆点坐标
points = [[50,50],[100,100],[50,100],[100,50],[150,50],[50,150]]
cv2 可视化的结果BGR 尺寸:[226,226,3]
plt 可视化的结果RGB 尺寸:[480,480,3]
完整代码
import cv2
import os
import numpy as np
from PIL import Image
import matplotlib.pyplot as plt

points = [[50,50],[100,100],[50,100],[100,50],[150,50],[50,150]]

if __name__ == "__main__":
    path_ = 'E:/DL/CSDN-blog/2022-12-19/imgs/'
    path_imgs = os.listdir(path_)

    imgs_array = [np.array(Image.open(path_+i)) for i in path_imgs]
    for k, img in enumerate(imgs_array):
        print(img.shape)
        plt.imshow(img)
        plt.gca().set_axis_off()
        plt.subplots_adjust(top=1, bottom=0, right=1, left=0, hspace=0, wspace=0)
        plt.margins(0, 0)
        ratio_in_out = 1  # 255
        for idx, (x, y) in enumerate(points):  ###
            x = int(x * ratio_in_out)
            y = int(y * ratio_in_out)
            plt.scatter([x], [y], marker=".", s=50)
            plt.text(x-5, y-5, f"({x},{y})")
            plt.plot([x, 113], [y, 113])
        plt.savefig(f"E:/DL/CSDN-blog/2022-12-19/{path_imgs[k]}", bbox_inches='tight', pad_inches=0)
        plt.close()

        for idx, (x, y) in enumerate(points):  ###
            cv2.circle(img, (x, y), 3, -1)
            cv2.line(img, (x,y), (113,113), (255,255,255), 1)
            cv2.putText(img, f"({x},{y})",(x-5,y-5),cv2.FONT_HERSHEY_SIMPLEX,0.3,(255,255,255),1)
        cv2.imwrite(f"E:/DL/CSDN-blog/2022-12-19/cv2_{path_imgs[k]}", img)