python的第一副图
2023-09-11 14:22:20 时间
在看《机械振动基础》时,看到老师的有一附图
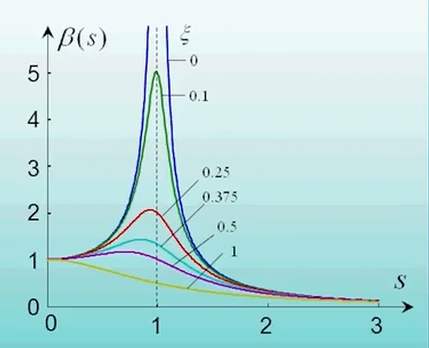
试着自己做下,v1代码为:
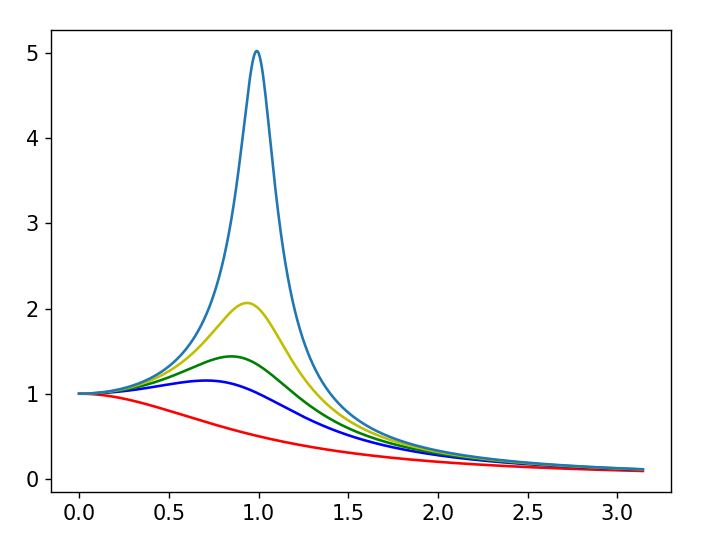
 1 from math import *
 2 from numpy import *
 3 import matplotlib.pyplot as plt
 4
 5 x = arange(0, math.pi, 0.00001)
 6 #y0 = [(math.sqrt((1-s**2)**2))**(-1) for s in x]
 7 y1 = [(math.sqrt((1-s**2)**2 + (2*s)**2))**(-1) for s in x]
 8 y2 = [(math.sqrt((1-s**2)**2 + (2*0.5*s)**2))**(-1) for s in x]
 9 y3 = [(math.sqrt((1-s**2)**2 + (2*0.375*s)**2))**(-1) for s in x]
10 y4 = [(math.sqrt((1-s**2)**2 + (2*0.25*s)**2))**(-1) for s in x]
11 y10 = [(math.sqrt((1-s**2)**2 + (2*0.1*s)**2))**(-1) for s in x]
12 plt.figure()
13 plt.plot(x, y1, color='r')
14 plt.plot(x, y2, color='b')
15 plt.plot(x, y3, color='g')
16 plt.plot(x, y4, color='y')
17 plt.plot(x, y10)
18 plt.show()
图形如下: