
GC日志分析工具一GCview使用介绍
2023-09-11 14:22:28 时间

目录
一、GCViewer介绍
业界较为流行分析GC日志的两个工具——GCViewer、GCEasy。GCEasy部分功能还是要收费的,今天笔者给大家介绍一下GCViewer的使用与功能点。Memory Analyzer Mat JVM 分析
二、GCViewer 使用
2.1 编译
GitHub - chewiebug/GCViewer at 1.36
首先,在github上搜索GCViewer项目,并下载到本地。GCViewer项目没有提供现成的release版本,利用如下maven编译命令即可完成GCViewer的编译工作,最终生成一个gcviewer-1.36.jar。
yum install  -y  git  svn  maven
cd  /hadoop/software/
unzip  GCViewer-1.36.zip
cd  GCViewer-1.36
## maven 编译 操作环境 Linux
mvn clean install -DskipTests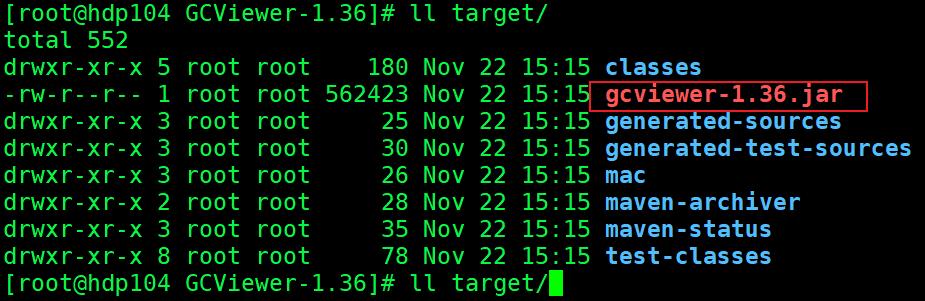
2.2 使用
双击编译好的jar

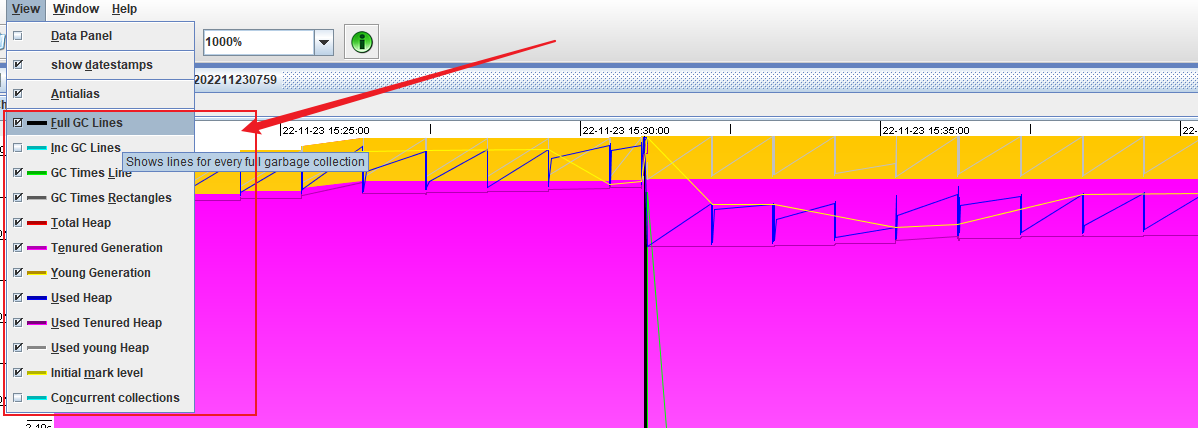
- Full GC Lines: (full gc)
- Inc GC Lines:(增量GC)
- GC Times Line: (gc 时间)
- GC Times Rectangles: (gc时间区域)
- Total Heap:(总堆大小)
- Red line that shows heap size
- Tenured Generation:(老年代)
- Young Generation:(年轻代)
- Used Heap:(堆使用量)
- Initial mark level:(cms或g1垃圾回收算法初始标记事件)
- Concurrent collections:(cms或g1垃圾回收并发收集周期)
运行Java程序打印下GC日志,垃圾收集器使用G1
/usr/java/jdk1.8.0_144/bin/java \
  -Xmx1024m -Xms1024m -XX:+UseG1GC -XX:MaxGCPauseMillis=100 \
  -XX:-ResizePLAB -verbose:gc -XX:-PrintGCCause -XX:+PrintAdaptiveSizePolicy \
  -XX:+PrintGCDetails -XX:+PrintGCDateStamps -Xloggc:/hadoop/datadir/windeploy/log/ETL/DS/gc.log-`date +'%Y%m%d%H%M'` \
  -classpath xxx.jar
在路径 /hadoop/datadir/windeploy/log/ETL/DS/ 就会产生gc日志,产生的部分日志如下:
2022-11-23T15:33:14.532+0800: 27253.342: [GC concurrent-root-region-scan-start]
2022-11-23T15:33:14.540+0800: 27253.350: [GC concurrent-root-region-scan-end, 0.0077278 secs]
2022-11-23T15:33:14.540+0800: 27253.350: [GC concurrent-mark-start]
2022-11-23T15:33:16.881+0800: 27255.691: [GC concurrent-mark-end, 2.3412370 secs]
2022-11-23T15:33:16.881+0800: 27255.691: [GC remark 2022-11-23T15:33:16.881+0800: 27255.691: [Finalize Marking, 0.0001521 secs] 2022-11-23T15:33:16.882+0800: 27255.692: [GC ref-proc, 0.0006298 secs] 2022-11-23T15:33:16.882+0800: 27255.692: [Unloading, 0.0118105 secs], 0.0180534 secs]
 [Times: user=0.04 sys=0.00, real=0.02 secs]
2022-11-23T15:33:16.900+0800: 27255.710: [GC cleanup 925M->925M(1024M), 0.0041387 secs]
 [Times: user=0.01 sys=0.00, real=0.00 secs]
2022-11-23T15:34:15.075+0800: 27313.885: [GC pause (young) 27313.885: [G1Ergonomics (CSet Construction) start choosing CSet, _pending_cards: 2602, predicted base time: 3.19 ms, remaining time: 96.81 ms, target pause time: 100.00 ms]
 27313.885: [G1Ergonomics (CSet Construction) add young regions to CSet, eden: 45 regions, survivors: 6 regions, predicted young region time: 7.09 ms]
 27313.885: [G1Ergonomics (CSet Construction) finish choosing CSet, eden: 45 regions, survivors: 6 regions, old: 0 regions, predicted pause time: 10.28 ms, target pause time: 100.00 ms]
 27313.895: [G1Ergonomics (Concurrent Cycles) do not request concurrent cycle initiation, reason: still doing mixed collections, occupancy: 941621248 bytes, allocation request: 0 bytes, threshold: 483183810 bytes (45.00 %), source: end of GC]
 27313.895: [G1Ergonomics (Mixed GCs) do not start mixed GCs, reason: reclaimable percentage not over threshold, candidate old regions: 8 regions, reclaimable: 2873312 bytes (0.27 %), threshold: 5.00 %]
, 0.0100596 secs]
   [Parallel Time: 8.9 ms, GC Workers: 4]
      [GC Worker Start (ms): Min: 27313885.0, Avg: 27313887.0, Max: 27313888.9, Diff: 4.0]
      [Ext Root Scanning (ms): Min: 0.0, Avg: 0.6, Max: 1.2, Diff: 1.2, Sum: 2.2]
      [Update RS (ms): Min: 0.0, Avg: 1.3, Max: 2.6, Diff: 2.6, Sum: 5.2]
         [Processed Buffers: Min: 0, Avg: 3.5, Max: 10, Diff: 10, Sum: 14]
      [Scan RS (ms): Min: 0.0, Avg: 0.0, Max: 0.0, Diff: 0.0, Sum: 0.1]
      [Code Root Scanning (ms): Min: 0.0, Avg: 0.0, Max: 0.0, Diff: 0.0, Sum: 0.0]
      [Object Copy (ms): Min: 4.9, Avg: 5.0, Max: 5.1, Diff: 0.2, Sum: 20.1]
      [Termination (ms): Min: 0.0, Avg: 0.0, Max: 0.0, Diff: 0.0, Sum: 0.0]
         [Termination Attempts: Min: 1, Avg: 1.0, Max: 1, Diff: 0, Sum: 4]
      [GC Worker Other (ms): Min: 0.0, Avg: 0.0, Max: 0.0, Diff: 0.0, Sum: 0.1]
      [GC Worker Total (ms): Min: 4.9, Avg: 6.9, Max: 8.9, Diff: 4.0, Sum: 27.6]
      [GC Worker End (ms): Min: 27313893.9, Avg: 27313893.9, Max: 27313893.9, Diff: 0.0]
   [Code Root Fixup: 0.1 ms]
   [Code Root Purge: 0.0 ms]
   [Clear CT: 0.1 ms]
   [Other: 1.0 ms]
      [Choose CSet: 0.0 ms]
      [Ref Proc: 0.7 ms]
      [Ref Enq: 0.0 ms]
      [Redirty Cards: 0.0 ms]
      [Humongous Register: 0.0 ms]
      [Humongous Reclaim: 0.0 ms]
      [Free CSet: 0.1 ms]
   [Eden: 45.0M(45.0M)->0.0B(46.0M) Survivors: 6144.0K->5120.0K Heap: 944.1M(1024.0M)->899.8M(1024.0M)]
 [Times: user=0.03 sys=0.00, real=0.01 secs]
2022-11-23T15:34:15.631+0800: 27314.441: [GC pause (young) 27314.441: [G1Ergonomics (CSet Construction) start choosing CSet, _pending_cards: 4127, predicted base time: 4.55 ms, remaining time: 95.45 ms, target pause time: 100.00 ms]
 27314.441: [G1Ergonomics (CSet Construction) add young regions to CSet, eden: 46 regions, survivors: 5 regions, predicted young region time: 6.81 ms]
 27314.441: [G1Ergonomics (CSet Construction) finish choosing CSet, eden: 46 regions, survivors: 5 regions, old: 0 regions, predicted pause time: 11.36 ms, target pause time: 100.00 ms]
 27314.450: [G1Ergonomics (Concurrent Cycles) request concurrent cycle initiation, reason: occupancy higher than threshold, occupancy: 942669824 bytes, allocation request: 0 bytes, threshold: 483183810 bytes (45.00 %), source: end of GC]
, 0.0093238 secs]
   [Parallel Time: 8.6 ms, GC Workers: 4]
      [GC Worker Start (ms): Min: 27314441.0, Avg: 27314441.0, Max: 27314441.0, Diff: 0.0]
      [Ext Root Scanning (ms): Min: 0.6, Avg: 0.7, Max: 0.7, Diff: 0.1, Sum: 2.7]
      [Update RS (ms): Min: 2.3, Avg: 2.5, Max: 2.7, Diff: 0.4, Sum: 9.9]
         [Processed Buffers: Min: 3, Avg: 5.2, Max: 9, Diff: 6, Sum: 21]
      [Scan RS (ms): Min: 0.0, Avg: 0.0, Max: 0.0, Diff: 0.0, Sum: 0.1]
      [Code Root Scanning (ms): Min: 0.0, Avg: 0.0, Max: 0.0, Diff: 0.0, Sum: 0.0]
      [Object Copy (ms): Min: 5.1, Avg: 5.3, Max: 5.5, Diff: 0.4, Sum: 21.4]
      [Termination (ms): Min: 0.0, Avg: 0.0, Max: 0.0, Diff: 0.0, Sum: 0.0]
         [Termination Attempts: Min: 1, Avg: 1.0, Max: 1, Diff: 0, Sum: 4]
      [GC Worker Other (ms): Min: 0.0, Avg: 0.0, Max: 0.0, Diff: 0.0, Sum: 0.1]
      [GC Worker Total (ms): Min: 8.5, Avg: 8.5, Max: 8.5, Diff: 0.0, Sum: 34.1]
      [GC Worker End (ms): Min: 27314449.5, Avg: 27314449.5, Max: 27314449.5, Diff: 0.0]
   [Code Root Fixup: 0.1 ms]
   [Code Root Purge: 0.0 ms]
   [Clear CT: 0.0 ms]
   [Other: 0.7 ms]
      [Choose CSet: 0.0 ms]
      [Ref Proc: 0.3 ms]
      [Ref Enq: 0.0 ms]
      [Redirty Cards: 0.0 ms]
      [Humongous Register: 0.0 ms]
      [Humongous Reclaim: 0.0 ms]
      [Free CSet: 0.1 ms]
   [Eden: 46.0M(46.0M)->0.0B(44.0M) Survivors: 5120.0K->7168.0K Heap: 945.8M(1024.0M)->903.2M(1024.0M)]
 [Times: user=0.03 sys=0.00, real=0.01 secs]
 27374.524: [G1Ergonomics (Concurrent Cycles) request concurrent cycle initiation, reason: occupancy higher than threshold, occupancy: 942669824 bytes, allocation request: 589840 bytes, threshold: 483183810 bytes (45.00 %), source: concurrent humongous allocation]
 27374.525: [G1Ergonomics (Concurrent Cycles) request concurrent cycle initiation, reason: requested by GC cause, GC cause: G1 Humongous Allocation]
 27374.525: [G1Ergonomics (Concurrent Cycles) initiate concurrent cycle, reason: concurrent cycle initiation requested]
2022-11-23T15:35:15.715+0800: 27374.525: [GC pause (young) (initial-mark) 27374.525: [G1Ergonomics (CSet Construction) start choosing CSet, _pending_cards: 1557, predicted base time: 3.33 ms, remaining time: 96.67 ms, target pause time: 100.00 ms]
 27374.525: [G1Ergonomics (CSet Construction) add young regions to CSet, eden: 12 regions, survivors: 7 regions, predicted young region time: 4.48 ms]
 27374.525: [G1Ergonomics (CSet Construction) finish choosing CSet, eden: 12 regions, survivors: 7 regions, old: 0 regions, predicted pause time: 7.81 ms, target pause time: 100.00 ms]
, 0.0065173 secs]
   [Parallel Time: 5.7 ms, GC Workers: 4]
      [GC Worker Start (ms): Min: 27374524.8, Avg: 27374524.8, Max: 27374524.8, Diff: 0.0]
      [Ext Root Scanning (ms): Min: 0.7, Avg: 0.8, Max: 0.8, Diff: 0.1, Sum: 3.0]
      [Update RS (ms): Min: 0.5, Avg: 0.6, Max: 0.9, Diff: 0.4, Sum: 2.5]
         [Processed Buffers: Min: 1, Avg: 2.2, Max: 5, Diff: 4, Sum: 9]
      [Scan RS (ms): Min: 0.0, Avg: 0.0, Max: 0.0, Diff: 0.0, Sum: 0.0]
      [Code Root Scanning (ms): Min: 0.0, Avg: 0.0, Max: 0.0, Diff: 0.0, Sum: 0.0]
      [Object Copy (ms): Min: 4.0, Avg: 4.2, Max: 4.3, Diff: 0.4, Sum: 16.9]
      [Termination (ms): Min: 0.0, Avg: 0.0, Max: 0.0, Diff: 0.0, Sum: 0.0]
         [Termination Attempts: Min: 1, Avg: 1.0, Max: 1, Diff: 0, Sum: 4]
      [GC Worker Other (ms): Min: 0.0, Avg: 0.0, Max: 0.0, Diff: 0.0, Sum: 0.1]
      [GC Worker Total (ms): Min: 5.6, Avg: 5.6, Max: 5.7, Diff: 0.0, Sum: 22.6]
      [GC Worker End (ms): Min: 27374530.4, Avg: 27374530.4, Max: 27374530.4, Diff: 0.0]
   [Code Root Fixup: 0.0 ms]
   [Code Root Purge: 0.0 ms]
   [Clear CT: 0.0 ms]
   [Other: 0.7 ms]
      [Choose CSet: 0.0 ms]
      [Ref Proc: 0.4 ms]
      [Ref Enq: 0.0 ms]
      [Redirty Cards: 0.0 ms]
      [Humongous Register: 0.0 ms]
      [Humongous Reclaim: 0.0 ms]
      [Free CSet: 0.0 ms]
   [Eden: 12.0M(44.0M)->0.0B(49.0M) Survivors: 7168.0K->2048.0K Heap: 915.2M(1024.0M)->901.1M(1024.0M)]
 [Times: user=0.02 sys=0.00, real=0.00 secs]
我使用 GCView 打开 GC日志,可以看到随着堆使用的越来越高,Full GC 频繁触发
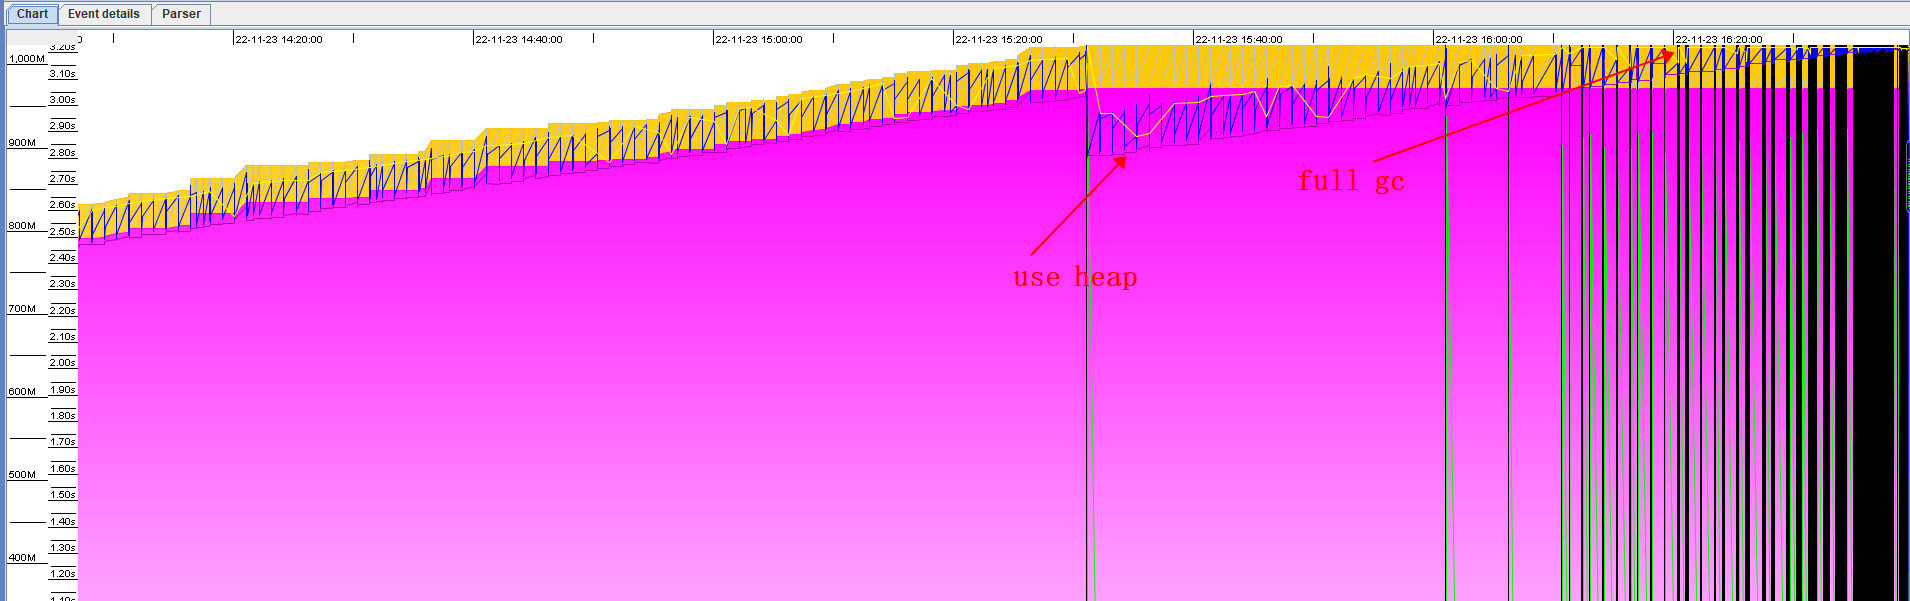
Summary、Memory、Pause

- 进程运行8+h。
- heap最大使用率达到 100%。

- 老年代最大使用率达到105.2%。
- 新生代最大使用率达到100%。

此工具只是对内存的基本分析,并没有详细的大对象信息 ,所以我又找到了 这个工具 Memory Analyzer Mat。Memory Analyzer Mat JVM 分析
感谢点赞和关注!
相关文章
- 重构前的程序:通过rsync命令抓取日志文件
- 第九章 使用日志监控 - 系统监控工具
- 运维日志审计是什么意思?用什么工具好?
- MySQL慢日志查询全解析:从参数、配置到分析工具
- Solr/Lucene日志分析-查询热点词-脚本工具
- 简化SLF4J和通用日志工具的区别
- Postgresql日志收集
- 几种常见的Windows日志转SYSLOG工具的使用方法
- Java日志最佳实践
- python更加灵活的Logger日志
- 《日志管理与分析权威指南》一3.2.3 Windows事件日志
- Unity3D 开发工具系列 日志系统:输出模块FileAppender
- CYQ.IISLogViewer 一款IIS 日志分析工具 V1.0 发布[提供源码]
- 【Java】日志输出自定义变量值
- 使用mysqlbinlog从二进制日志文件中查询mysql执行过的sql语句 (原)
- 【转载】一个人的安全部之ELK接收Paloalto日志并用钉钉告警
- Anroid 工具类 —— 日志