
Android图表控件MPAndroidChart的简单介绍(MPAndroidChart3.0)
Android 简单 介绍 控件 图表
2023-09-11 14:18:54 时间
MPAndroidChart在github上16.6K个star,是一款十分强大的图表框架。
前面写了几篇使用MPAndroidChart库显示图标控件的文章,只是把代码贴出来了而已,现在简单介绍一下最新的图表控件的使用方法。
相关文章:
Android图表控件MPAndroidChart的简单介绍(MPAndroidChart3.0)
Android图表控件MPAndroidChart——曲线图LineChart的使用(多条曲线)
Android图表控件MPAndroidChart——曲线图LineChart(多条曲线)动态添加数据
Android图表控件MPAndroidChart——柱状图BarChart的使用(多条柱状图)
Android图表控件MPAndroidChart——曲线图+柱状图 CombinedChart的使用
Android图表控件MPAndroidChart——源码修改实现曲线图X轴直尺刻度样式
我的Android Studio 使用的是Eclipse模式的快捷键,查看Chart类,按下F4可查看和Chart相关的继承关系,如下图
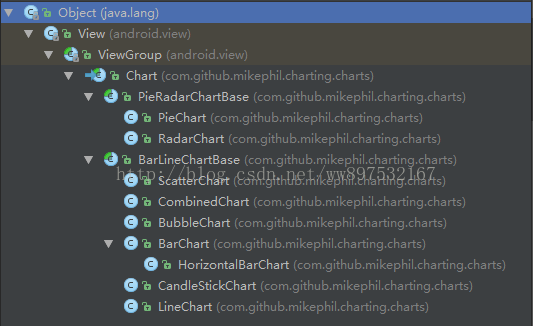
每个类对应的图是什么github上有详细的介绍
图表类具有相同的地方
X轴:XAxis
Y轴:YAxis
图例:Legend
描述:Description
限制线:LimitLine
选中图表中的值,可显示的视图:MarkerView 具体在图表中的表现如下图

以曲线图为例
依赖:project
build.gradle 中
allprojects {
    repositories {
        jcenter()
        maven { url "https://jitpack.io" }
    }
}
app
build.gradle 中
compile 'com.github.PhilJay:MPAndroidChart:v3.0.2'
最简单的代码
<RelativeLayout
    xmlns:android="http://schemas.android.com/apk/res/android"
    android:layout_width="match_parent"
    android:layout_height="match_parent"
    android:orientation="vertical">

    <com.github.mikephil.charting.charts.LineChart
        android:id="@+id/lineChart"
        android:layout_width="match_parent"
        android:layout_height="300dp"
        android:layout_centerInParent="true"/>
</RelativeLayout>
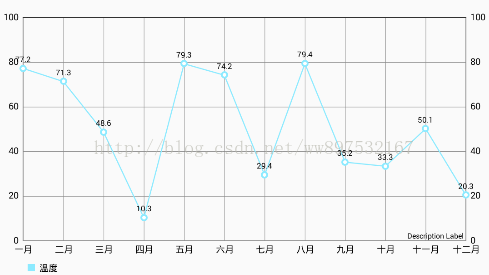
@Override
protected void onCreate(Bundle savedInstanceState) {
    super.onCreate(savedInstanceState);
    setContentView(R.layout.activity_main);
    LineChart mLineChart = (LineChart) findViewById(R.id.lineChart);
    //显示边界
    mLineChart.setDrawBorders(true);
    //设置数据
    List<Entry> entries = new ArrayList<>();
    for (int i = 0; i < 10; i++) {
        entries.add(new Entry(i, (float) (Math.random()) * 80));
    }
    //一个LineDataSet就是一条线
    LineDataSet lineDataSet = new LineDataSet(entries, "温度");
    LineData data = new LineData(lineDataSet);
    mLineChart.setData(data);
}
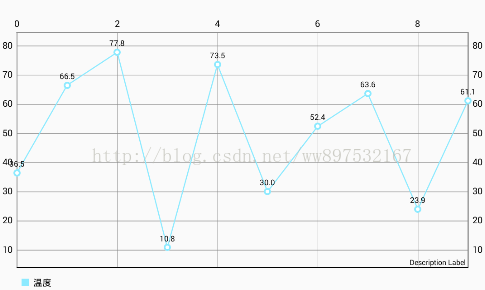
效果图:
一.XAxis(X轴)
1.得到X轴:
XAxis xAxis = mLineChart.getXAxis();
2.设置X轴的位置(默认在上方):
xAxis.setPosition(XAxis.XAxisPosition.BOTTOM);//值:BOTTOM,BOTH_SIDED,BOTTOM_INSIDE,TOP,TOP_INSIDE
3.设置X轴坐标之间的最小间隔(因为此图有缩放功能,X轴,Y轴可设置可缩放)
xAxis.setGranularity(1f);
对比图:左图X轴在图缩放时值的间隔会按比例改变,而右图进行设置后,最小间隔始终为1


4.设置X轴的刻度数量
xAxis.setLabelCount(12, true);
第二个参数表示是否平均分配 如果为true则按比例分为12个点、如果为false则适配X刻度的值来分配点,可能没有12个点。
对比图:左图的参数为true,右图的参数为false

5.设置X轴的值(最小值、最大值、然后会根据设置的刻度数量自动分配刻度显示)
xAxis.setAxisMinimum(0f);
xAxis.setAxisMaximum(20f);
前面是的X轴是根据(X,Y)的值默认显示的X轴,现在才是真正的设置规定的值
效果图:

6.设置X轴值为字符串(如上右图)
xAxis.setValueFormatter(new IAxisValueFormatter() {
    @Override
    public String getFormattedValue(float value, AxisBase axis) {
        return mList.get((int) value); //mList为存有月份的集合
    }
});
想要显示完整的12个月份,要与(x,y)坐标对应数量 10 改成 12
for (int i = 0; i < 12; i++) {
    entries.add(new Entry(i, (float) (Math.random()) * 80));
}
还有设置线条颜色、字体颜色、等等,可查看详细的文档。
7.
取消曲线显示的值为整数
与设置自定义X轴类似,设置曲线显示值为整数,可在设置曲线LineDataSet 时,修改值的类型
lineDataSet.setValueFormatter(new IValueFormatter() {
    @Override
    public String getFormattedValue(float value, Entry entry, int dataSetIndex, ViewPortHandler viewPortHandler) {
        int IValue = (int) value;
        return String.valueOf(IValue);
    }
});
二.YAxis(Y轴)
如上面的图所示,Y轴总会高出X轴一点,并没有从0点开始,因此需要对Y轴进行设置
Y轴和X轴类似
1.得到Y轴
YAxis leftYAxis = mLineChart.getAxisLeft();
YAxis rightYAxis = mLineChart.getAxisRight();
2.设置从Y轴值
leftYAxis.setAxisMinimum(0f);
leftYAxis.setAxisMaximum(100f);

rightYAxis.setAxisMinimum(0f);
rightYAxis.setAxisMaximum(100f);
以及
leftYAxis.setValueFormatter(new IAxisValueFormatter() {
    @Override
    public String getFormattedValue(float value, AxisBase axis) {
        return (int) value + "%";
    }
});
效果图:

3.设置Y轴是否显示(效果如上右图)
rightYAxis.setEnabled(false); //右侧Y轴不显示
4.X轴和Y轴类似,都具有相同的属性方法
rightYAxis.setGranularity(1f);
rightYAxis.setLabelCount(11,false);
rightYAxis.setTextColor(Color.BLUE); //文字颜色
rightYAxis.setGridColor(Color.RED); //网格线颜色
rightYAxis.setAxisLineColor(Color.GREEN); //Y轴颜色

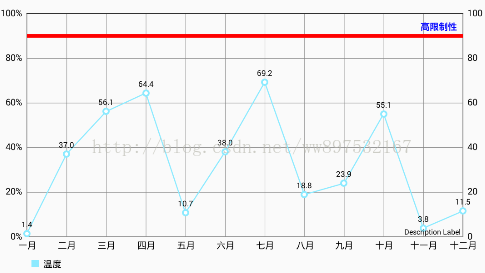
5.限制线LimitLine(如上右图)
LimitLine limitLine = new LimitLine(95,"高限制性"); //得到限制线
limitLine.setLineWidth(4f); //宽度
limitLine.setTextSize(10f);
limitLine.setTextColor(Color.RED);  //颜色
limitLine.setLineColor(Color.BLUE);
rightYAxis.addLimitLine(limitLine); //Y轴添加限制线
三.Legend(图例:即上图所示的曲线图下面的 温度)
1.得到Lengend
Legend legend = mLineChart.getLegend();
2.设置Lengend位置
legend.setTextColor(Color.CYAN); //设置Legend 文本颜色
legend.setVerticalAlignment(Legend.LegendVerticalAlignment.BOTTOM);
legend.setHorizontalAlignment(Legend.LegendHorizontalAlignment.CENTER);
legend.setOrientation(Legend.LegendOrientation.HORIZONTAL);

3.设置标签是否换行(当多条标签时 需要换行显示、如上右图)
true:可换行。false:不换行
legend.setWordWrapEnabled(true);
4.隐藏Lengend
legend.setEnabled(false);
如下图所示
四.Description(描述)
1.隐藏描述
Description description = new Description();
description.setEnabled(false);
mLineChart.setDescription(description);
2.设置描述内容
Description description = new Description();
description.setText("X轴描述");
description.setTextColor(Color.RED);
mLineChart.setDescription(description);

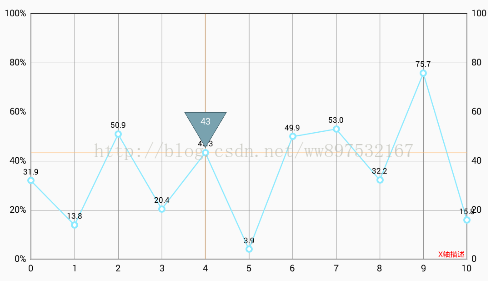
五.MarkerView
MarkerView可自定义,用于点击图标值时显示想要的内容 效果如上右图
1.自定义MarkerView
public class MyMarkerView extends MarkerView {

    private TextView tvContent;
    private DecimalFormat format = new DecimalFormat("##0");

    public MyMarkerView(Context context) {
        super(context, R.layout.layout_markerview);
        tvContent = (TextView) findViewById(R.id.tvContent);
    }

    @Override
    public void refreshContent(Entry e, Highlight highlight) {
        tvContent.setText(format.format(e.getY()));
        super.refreshContent(e, highlight);
    }

    @Override
    public MPPointF getOffset() {
        return new MPPointF(-(getWidth() / 2), -getHeight() - 10);
    }
}
2.设置显示MarkerView
MyMarkerView mv = new MyMarkerView(this);
mLineChart.setMarkerView(mv);
折线图的线条设置
//一个LineDataSet就是一条线
LineDataSet lineDataSet = new LineDataSet(entries, "温度");
//设置曲线值的圆点是实心还是空心
lineDataSet.setDrawCircleHole(false);
//设置显示值的字体大小
lineDataSet.setValueTextSize(9f);
//线模式为圆滑曲线(默认折线)
lineDataSet.setMode(LineDataSet.Mode.CUBIC_BEZIER);

柱状图,饼状图,组合图等等,用法类似,方法很多,无法列举,遇见问题时多看官方文档
在附一下地址
我以前写的一些管理类可做点参考:
https://github.com/897532167/ChartManager
相关文章
- Android AIDL Service 跨进程传递复杂数据
- 我的Android进阶之旅------>Android关于Log的一个简单封装
- Android 自定义ImageView加载图片
- 【Android界面实现】使用PagerTabStrip实现有滑动标签的Viewpager
- 【Android 应用开发】 ActionBar 样式具体解释 -- 样式 主题 简单介绍 Actionbar 的 icon logo 标题 菜单样式改动
- Android 发布开源库到 JitPack (详细步骤)
- Android Studio Profiler Memory (内存分析工具)的简单使用及问题分析
- Android----View
- Android网络请求与数据解析,使用Gson和GsonFormat解析复杂Json数据
- Android入门教程(二)
- Xamarin Android设置界面提示类型错误
- Android 快速集成文档校正能力 超简单
- 《Android 应用案例开发大全(第二版)》——2.9节壁纸的优化与改进
- 《Android游戏开发详解》——第1章,第1.4节关于位的一切(位和字节的简单介绍)
- 《Android游戏开发详解》一2.10 使用对象
- 实现Android Studio JNI开发C/C++使用__android_log_print输出Log
- Android 图标上面添加提醒(一)使用Canvas绘制
- Android Scroller简单用法
- android HorizontalListView
- android控件上面实现提醒信息
- Android权限设置android.permission完整列表
- android开发:Android 中自定义属性(attr.xml,TypedArray)的使用
- android 有时候stroke不起作用
- 利用drozer进行Android渗透测试
- 使用 Amazon Amplify快速创建简单的 Android 应用程序
- Android bluetooth介绍(两): android 蓝牙源架构和uart 至rfcomm过程
- Android Studio怎样提示函数使用方法
- 12个被滥用的Android应用程序权限
- Android 最火高速开发框架AndroidAnnotations简单介绍
- 超简单一行代码实现应用双开,仿照微信双开、QQ双开等实现app应用双开,即采用Android插件化开发在免安装情况下加载使用原生app
- 对 Android 开发者有益的 40 条优化建议