
使用cProfile等工具来提高python的执行速度
更多深度文章,请关注:https://yq.aliyun.com/cloud
本文假定你已经十分熟悉Python。
众所周知,Python是一种解释性的语言,执行速度相比C、C++等语言十分缓慢;因此我们需要在其它地方上下功夫来提高代码的执行速度。
首先需要对代码进行分析。
代码分析
傻乎乎地一遍又一遍地检查代码并不会对分析代码的执行时间有多大帮助,你需要借助一些工具。
先看下面这段程序:
"""Sorting a large, randomly generated string and writing it to disk"""

import random

def write_sorted_letters(nb_letters=10**7):

 random_string =

 for i in range(nb_letters):

 random_string += random.choice(abcdefghijklmnopqrstuvwxyz)

 sorted_string = sorted(random_string)

 with open("sorted_text.txt", "w") as sorted_text:

 for character in sorted_string:

 sorted_text.write(character)

write_sorted_letters()
瓶颈在磁盘存取,很显然易见是不是?我们走着瞧。
调优器(profiler)能够精确地告诉我们程序在执行时发生了什么。它能够自动计时并计数程序中的每一行代码,从而节省大量时间,是优化代码的第一选择。
全代码分析
所有合格的IDE都集成有一个调优器,点一下就可以了;如果是在命令行中进行调用,代码如下:
python -m cProfile -s tottime your_program.py
结果如下:
 40000054 function calls in 11.362 seconds

 Ordered by: internal time

 ncalls tottime percall cumtime percall filename:lineno(function)

 10000000 4.137 0.000 5.166 0.000 random.py:273(choice)

 1 3.442 3.442 11.337 11.337 sort.py:5(write_sorted_letters)

 1 1.649 1.649 1.649 1.649 {sorted}

 10000000 0.960 0.000 0.960 0.000 {method write of file objects}

 10000000 0.547 0.000 0.547 0.000 {method random of _random.Random objects}

 10000000 0.482 0.000 0.482 0.000 {len}

 1 0.121 0.121 0.121 0.121 {range}

 1 0.021 0.021 11.362 11.362 sort.py:1( module )

...
结果按总时间排序(-s tottime),靠前的更应该被优化。本例中,random模组中的choice函数花费了总时间的将近1/3,现在你知道瓶颈在哪里了吧。
迫不及待去做优化了?别急,代码分析有好几种方法。
块分析
你可能已经注意到,之前我们是对整个程序段进行分析的。如果你只对某一部分代码感兴趣,只需要在这部分代码的前后加上下面这两段代码即可:
import cProfile

cp = cProfile.Profile()

cp.enable()

cp.disable()

cp.print_stats()
结果与全代码分析的类似,但是只包含你感兴趣的部分。但是一般来说,你不应该直接使用块分析,在这之前请务必先做因此全代码分析。
有关cProfile还有Profile的更多信息,请点击。
行分析
比块分析更精确地是行分析。进行行分析需要额外安装line_profiler:
pip install line_profiler
安装成功后,修改代码,在每一行你想分析的代码前增加@profile,如下所示:
@profile

def write_sorted_letters(nb_letters=10**7):

 ...
最后在命令行中输入如下代码:
kernprof -l -v your_program.py

· -l 逐行分析

· -v 立即查看结果
结果如下所示:
Total time: 21.4412 s

File: ./sort.py

Function: write_sorted_letters at line 5

Line # Hits Time Per Hit % Time Line Contents

================================================================

 5 @profile

 6 def write_sorted_letters(nb_letters=10**7):

 7 1 1 1.0 0.0 random_string =

 8 10000001 3230206 0.3 15.1 for _ in range(nb_letters):

 9 10000000 9352815 0.9 43.6 random_string += random.choice(abcdefghijklmnopqrstuvwxyz)

 10 1 1647254 1647254.0 7.7 sorted_string = sorted(random_string)

 12 1 1334 1334.0 0.0 with open("sorted_text.txt", "w") as sorted_text:

 13 10000001 2899712 0.3 13.5 for character in sorted_string:

 14 10000000 4309926 0.4 20.1 sorted_text.write(character)
注意,代码执行的速度变慢了,从11秒上升到了21秒。但是瑕不掩瑜,我们知道了是哪一行拖了整段代码的后腿。
实时不间断网页应用该如何分析代码?
我们先来看一下需要的Profiling module。
安装后通过如下命令运行:profiling your_program.py。不要忘了删除在行分析中使用的装饰器(@profile)。
结果如下所示:
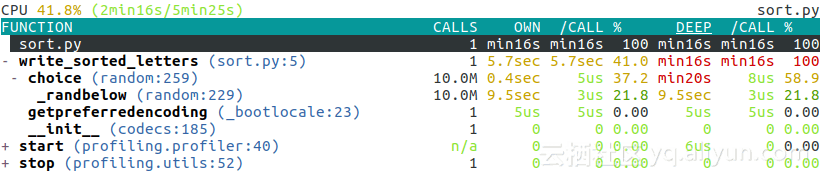
结果是交互式的,你可以使用方向键轻松浏览或者折叠/打开每一行。
如果是需要长时间运行的程序(譬如网页服务器),也有响应的分析代码,命令类似于:profiling live-profile your_server_program.py。一旦开始运行,你可以在程序运行时与之交互,并观察程序的性能。
分析方法
优化
想知道你是否在循环中浪费了大量时间?现在我们知道程序在哪些地方花费了大量CPU时间,我们可以针对性的进行优化。
注意
只有在必要的时候和必要的地方才进行优化,因为优化后的代码通常比优化前更加难以理解和维护。
简单而言,优化是拿可维护性换取性能。
Numpy
看起来random.choice函数拖了后腿,就让我们使用著名的numpy库中的类似函数来代替它。新代码如下:
"""Sorting a large, randomly generated string and writing it to disk"""

from numpy import random


def write_sorted_letters(nb_letters=10**7):

 letters = tuple(abcdefghijklmnopqrstuvwxyz)

 random_letters = random.choice(letters, nb_letters)

 random_letters.sort()

 sorted_string = random_letters.tostring()

 with open("sorted_text.txt", "w") as sorted_text:

 for character in sorted_string:

 sorted_text.write(character)

write_sorted_letters()
Numpy包含有许多强大且速度块的数学函数,安装命令为:pip install numpy。
对优化后的代码进行性能分析,结果如下:
 10011861 function calls (10011740 primitive calls) in 3.357 seconds

 Ordered by: internal time

 ncalls tottime percall cumtime percall filename:lineno(function)

 10000000 1.272 0.000 1.272 0.000 {method write of file objects}

 1 1.268 1.268 3.321 3.321 numpy_sort.py:5(write_sorted_letters)

 1 0.657 0.657 0.657 0.657 {method sort of numpy.ndarray objects}

 1 0.120 0.120 0.120 0.120 {method choice of mtrand.RandomState objects}

 4 0.009 0.002 0.047 0.012 __init__.py:1( module )

 1 0.003 0.003 0.003 0.003 {method tostring of numpy.ndarray objects}

...
新代码比之前的版本块了将近4倍(3.3秒vs11.362秒)!现在轮到写操作拖后腿了,优化方法是舍弃如下代码
with open("sorted_text.txt", "w") as sorted_text:

 for character in sorted_string:

 sorted_text.write(character)
代之以如下代码:
with open("sorted_text.txt", "w") as sorted_text:

 sorted_text.write(sorted_string)
新代码一次写入整个字符串,而之前是逐个字符写入。
统计一下整段代码的时间,如下所示:
time python your_program.py

Which gives us:

real 0m0.874s

user 0m0.852s

sys 0m0.280s
总时间从11秒减少到了不到1秒!是不是很棒?
其它优化技巧
记住电脑中的这些参数
Latency Comparison Numbers

--------------------------

L1 cache reference 0.5 ns

Branch mispredict 5 ns

L2 cache reference 7 ns 14x L1 cache

Mutex lock/unlock 25 ns

Main memory reference 100 ns 20x L2 cache, 200x L1 cache

Compress 1K bytes with Zippy 3,000 ns 3 us

Send 1K bytes over 1 Gbps network 10,000 ns 10 us

Read 4K randomly from SSD* 150,000 ns 150 us ~1GB/sec SSD

Read 1 MB sequentially from memory 250,000 ns 250 us

Round trip within same datacenter 500,000 ns 500 us

Read 1 MB sequentially from SSD* 1,000,000 ns 1,000 us 1 ms ~1GB/sec SSD, 4X memory

Disk seek 10,000,000 ns 10,000 us 10 ms 20x datacenter roundtrip

Read 1 MB sequentially from disk 20,000,000 ns 20,000 us 20 ms 80x memory, 20X SSD

Send packet CA- Netherlands- CA 150,000,000 ns 150,000 us 150 ms
来自于Latency Numbers Every Programmer Should Know
其它资源
· Numpy
· Numba,通过JIT(just in time)甚至GPU的使用来加速代码。
· Anaconda,一个集成环境,包含了Numpy、Numba以及其它许多针对数据科学还有数学计算的扩展包。
作者:Sylvain Josserand。
译者注:原文提供的代码在验证时存在些许问题,可能是版本不一造成的。
本文由北邮@爱可可-爱生活老师推荐,阿里云云栖社区组织翻译。
文章原标题《Profiling and optimizing your Python code》,作者:Sylvain Josserand,译者:杨辉,审阅:,附件为原文的pdf。
文章为简译,更为详细的内容,请查看原文
python接口自动化(二十六)--批量执行用例 discover(详解) 我们在写用例的时候,单个脚本的用例好执行,那么多个脚本的时候,如何批量执行呢?这时候就需要用到 unittest 里面的 discover 方法来加载用例了。加载用例后,用 unittest 里面的 TextTestRunner 这里类的 run 方法去一次执行多个脚 本的用例。那么前边介绍那么多都是半道开始,半道出家,这篇就带大家从头到尾,一步一步给小伙伴们详细介绍一下。
相关文章
- Python 包管理工具 pip 安装 和 使用
- 深度学习部署C++和python的交互,不同编程语言的交互
- python是否存在某个字符串 效率最高_Python中判断子串存在的性能比较及分析总结...
- Python任意参数的数量/预习课python基础
- Go/Python/Erlang编程语言对比分析及示例 基于RabbitMQ.Client组件实现RabbitMQ可复用的 ConnectionPool(连接池) 封装一个基于NLog+NLog.Mongo的日志记录工具类LogUtil 分享基于MemoryCache(内存缓存)的缓存工具类,C# B/S 、C/S项目均可以使用!
- python中os.path.dirname(__file__)的使用(获取文件夹路径)(获取当前py文件绝对路径)
- Python变量/运算符/函数/模块/string
- python判断语句if...elif...else、if嵌套、三目运算符
- 35岁了转行python可以吗?什么样的人合适学习Python?
- 【python实战】拒绝黄牛!我要用python原价冲周董演唱会~Python自动秒杀抢票脚本
- python基础——实例属性和类属性
- 58 python - 异常的传递
- Python爬虫技术--基础篇--Web开发(上)
- Python 打开目录与指定文件
- Python之filter筛选数据工具
- python uzip
- python学习之基于Python的人脸识别技术学习
- Python 教程之如何使用 matplotlib 在 python 中绘制数学函数
- BP神经网络与Python实现
- 分享 10 个高频 Python 面试题
- 深入理解Python生成器和yield
- 【华为OD机试真题 java、c++、python、JsNode】查找重复代码(100%通过+复盘思路)
- Python学习---模拟微信网页登录180410
- 华为OD机试 - 找数字(Python)
- Python 工具 之 Anaconda 的下载、安装、环境创建,以及结合Pycharm在其Python环境下运行第一个HelloWorld
- 【爬虫系列】【Python】python with as的用法