
Java相关脚本-排查最消耗CPU的线程\Jar冲突
🐌 Java相关脚本
关于Java排错与诊断,力荐️Arthas ❤️
- alibaba/arthas: Alibaba Java诊断利器 - github.com
Arthas用户文档 https://alibaba.github.io/arthas/
Arthas功能异常(😜)强劲,且在阿里巴巴线上支持使用多年。我自己也常用,一定要看看用用!
Arthas是通过Agent方式来连接运行的Java进程、主要通过交互式来完成功能,与之对应的脚本方式也有其优势,如:
- 可以在进程不能启动的情况下完成诊断(如依赖中的重复类分析、
ClassPath上的资源或类查找) - 开销少;简单少依赖(就纯文本的一个脚本文件)
- 方便与(已有的)工具(如
awk、sed、cron)、流程或设施集成,进一步编程/自动化
请按需按场景选用。
🍺 show-busy-java-threads
用于快速排查Java的CPU性能问题(top us值过高),自动查出运行的Java进程中消耗CPU多的线程,并打印出其线程栈,从而确定导致性能问题的方法调用。
目前只支持Linux。原因是Mac、Windows的ps命令不支持列出进程的线程id,更多信息参见#33,欢迎提供解法。
PS,如何操作可以参见@bluedavy的《分布式Java应用》的【5.1.1 CPU消耗分析】一节,说得很详细:
top命令找出消耗CPU高的Java进程及其线程id:- 开启线程显示模式(
top -H,或是打开top后按H) - 按
CPU使用率排序(top缺省是按CPU使用降序,已经合要求;打开top后按P可以显式指定按CPU使用降序) - 记下
Java进程id及其CPU高的线程id
- 开启线程显示模式(
- 查看消耗
CPU高的线程栈:- 用进程
id作为参数,jstack出有问题的Java进程 - 手动转换线程
id成十六进制(可以用printf %x 1234) - 在
jstack输出中查找十六进制的线程id(可以用vim的查找功能/0x1234,或是grep 0x1234 -A 20)
- 用进程
- 查看对应的线程栈,分析问题
查问题时,会要多次上面的操作以分析确定问题,这个过程太繁琐太慢了。
用法
show-busy-java-threads
# 从所有运行的Java进程中找出最消耗CPU的线程(缺省5个),打印出其线程栈

# 缺省会自动从所有的Java进程中找出最消耗CPU的线程,这样用更方便
# 当然你可以手动指定要分析的Java进程Id,以保证只会显示你关心的那个Java进程的信息
show-busy-java-threads -p <指定的Java进程Id>

show-busy-java-threads -c <要显示的线程栈数>

show-busy-java-threads <重复执行的间隔秒数> [<重复执行的次数>]
# 多次执行;这2个参数的使用方式类似vmstat命令

show-busy-java-threads -a <运行输出的记录到的文件>
# 记录到文件以方便回溯查看

show-busy-java-threads -S <存储jstack输出文件的目录>
# 指定jstack输出文件的存储目录,方便记录以后续分析

##############################
# 注意:
##############################
# 如果Java进程的用户 与 执行脚本的当前用户 不同,则jstack不了这个Java进程
# 为了能切换到Java进程的用户,需要加sudo来执行,即可以解决:
sudo show-busy-java-threads

show-busy-java-threads -s <指定jstack命令的全路径>
# 对于sudo方式的运行,JAVA_HOME环境变量不能传递给root,
# 而root用户往往没有配置JAVA_HOME且不方便配置,
# 显式指定jstack命令的路径就反而显得更方便了

# -m选项:执行jstack命令时加上-m选项,显示上Native的栈帧,一般应用排查不需要使用
show-busy-java-threads -m
# -F选项:执行jstack命令时加上 -F 选项(如果直接jstack无响应时,用于强制jstack),一般情况不需要使用
show-busy-java-threads -F
# -l选项:执行jstack命令时加上 -l 选项,显示上更多相关锁的信息,一般情况不需要使用
# 注意:和 -m -F 选项一起使用时,可能会大大增加jstack操作的耗时
show-busy-java-threads -l

# 帮助信息
$ show-busy-java-threads -h
Usage: show-busy-java-threads [OPTION]... [delay [count]]
Find out the highest cpu consumed threads of java processes,
and print the stack of these threads.

Example:
  show-busy-java-threads       # show busy java threads info
  show-busy-java-threads 1     # update every 1 second, (stop by eg: CTRL+C)
  show-busy-java-threads 3 10  # update every 3 seconds, update 10 times

Output control:
  -p, --pid <java pid>      find out the highest cpu consumed threads from
                            the specified java process.
                            default from all java process.
  -c, --count <num>         set the thread count to show, default is 5.
  -a, --append-file <file>  specifies the file to append output as log.
  -S, --store-dir <dir>     specifies the directory for storing
                            the intermediate files, and keep files.
                            default store intermediate files at tmp dir,
                            and auto remove after run. use this option to keep
                            files so as to review jstack/top/ps output later.
  delay                     the delay between updates in seconds.
  count                     the number of updates.
                            delay/count arguments imitates the style of
                            vmstat command.

jstack control:
  -s, --jstack-path <path>  specifies the path of jstack command.
  -F, --force               set jstack to force a thread dump. use when jstack
                            does not respond (process is hung).
  -m, --mix-native-frames   set jstack to print both java and native frames
                            (mixed mode).
  -l, --lock-info           set jstack with long listing.
                            prints additional information about locks.

CPU usage calculation control:
  -d, --top-delay           specifies the delay between top samples.
                            default is 0.5 (second). get thread cpu percentage
                            during this delay interval.
                            more info see top -d option. eg: -d 1 (1 second).
  -P, --use-ps              use ps command to find busy thread(cpu usage)
                            instead of top command.
                            default use top command, because cpu usage of
                            ps command is expressed as the percentage of
                            time spent running during the *entire lifetime*
                            of a process, this is not ideal in general.

Miscellaneous:
  -h, --help                display this help and exit.
示例
$ show-busy-java-threads
[1] Busy(57.0%) thread(23355/0x5b3b) stack of java process(23269) under user(admin):
"pool-1-thread-1" prio=10 tid=0x000000005b5c5000 nid=0x5b3b runnable [0x000000004062c000]
   java.lang.Thread.State: RUNNABLE
    at java.text.DateFormat.format(DateFormat.java:316)
    at com.xxx.foo.services.common.DateFormatUtil.format(DateFormatUtil.java:41)
    at com.xxx.foo.shared.monitor.schedule.AppMonitorDataAvgScheduler.run(AppMonitorDataAvgScheduler.java:127)
    at com.xxx.foo.services.common.utils.AliTimer$2.run(AliTimer.java:128)
    at java.util.concurrent.ThreadPoolExecutor$Worker.runTask(ThreadPoolExecutor.java:886)
    at java.util.concurrent.ThreadPoolExecutor$Worker.run(ThreadPoolExecutor.java:908)
    at java.lang.Thread.run(Thread.java:662)

[2] Busy(26.1%) thread(24018/0x5dd2) stack of java process(23269) under user(admin):
"pool-1-thread-2" prio=10 tid=0x000000005a968800 nid=0x5dd2 runnable [0x00000000420e9000]
   java.lang.Thread.State: RUNNABLE
    at java.util.Arrays.copyOf(Arrays.java:2882)
    at java.lang.AbstractStringBuilder.expandCapacity(AbstractStringBuilder.java:100)
    at java.lang.AbstractStringBuilder.append(AbstractStringBuilder.java:572)
    at java.lang.StringBuffer.append(StringBuffer.java:320)
    - locked <0x00000007908d0030> (a java.lang.StringBuffer)
    at java.text.SimpleDateFormat.format(SimpleDateFormat.java:890)
    at java.text.SimpleDateFormat.format(SimpleDateFormat.java:869)
    at java.text.DateFormat.format(DateFormat.java:316)
    at com.xxx.foo.services.common.DateFormatUtil.format(DateFormatUtil.java:41)
    at com.xxx.foo.shared.monitor.schedule.AppMonitorDataAvgScheduler.run(AppMonitorDataAvgScheduler.java:126)
    at com.xxx.foo.services.common.utils.AliTimer$2.run(AliTimer.java:128)
    at java.util.concurrent.ThreadPoolExecutor$Worker.runTask(ThreadPoolExecutor.java:886)
    at java.util.concurrent.ThreadPoolExecutor$Worker.run(ThreadPoolExecutor.java:908)
    at java.lang.Thread.run(Thread.java:662)

......
上面的线程栈可以看出,CPU消耗最高的2个线程都在执行java.text.DateFormat.format,业务代码对应的方法是shared.monitor.schedule.AppMonitorDataAvgScheduler.run。可以基本确定:
AppMonitorDataAvgScheduler.run调用DateFormat.format次数比较频繁。DateFormat.format比较慢。(这个可以由DateFormat.format的实现确定。)
多执行几次show-busy-java-threads,如果上面情况高概率出现,则可以确定上面的判定。
因为调用越少代码执行越快,则出现在线程栈的概率就越低。
脚本有自动多次执行的功能,指定 重复执行的间隔秒数/重复执行的次数 参数。
分析shared.monitor.schedule.AppMonitorDataAvgScheduler.run实现逻辑和调用方式,以优化实现解决问题。
贡献者
- silentforce改进此脚本,增加对环境变量
JAVA_HOME的判断。 #15 - liuyangc3
- superhj1987 / lirenzuo
- 提出/实现了多次执行的功能 superhj1987/awesome-scripts#1
- xiongchen2012 提出并解决了长用户名截断的Bug #62
- qsLI / sdslnmd
- 发现并提交Issue:show-busy-java-threads支持top来获取cpu占用率,ps的cpu占用率非实时 #67
- geekMessi
🍺 show-duplicate-java-classes
找出Java Lib(Java库,即Jar文件)或Class目录(类目录)中的重复类。
全系统支持(Python实现,安装Python即可),如Linux、Mac、Windows。
Java开发的一个麻烦的问题是Jar冲突(即多个版本的Jar),或者说重复类。会出NoSuchMethod等的问题,还不见得当时出问题。找出有重复类的Jar,可以防患未然。
用法
- 通过脚本参数指定
Libs目录,查找目录下Jar文件,收集Jar文件中Class文件以分析重复类。可以指定多个Libs目录。
注意,只会查找这个目录下Jar文件,不会查找子目录下Jar文件。因为Libs目录一般不会用子目录再放Jar,这样也避免把去查找不期望Jar。 - 通过
-c选项指定Class目录,直接收集这个目录下的Class文件以分析重复类。可以指定多个Class目录。
# 查找当前目录下所有Jar中的重复类
show-duplicate-java-classes

# 查找多个指定目录下所有Jar中的重复类
show-duplicate-java-classes path/to/lib_dir1 /path/to/lib_dir2

# 查找多个指定Class目录下的重复类。 Class目录 通过 -c 选项指定
show-duplicate-java-classes -c path/to/class_dir1 -c /path/to/class_dir2

# 查找指定Class目录和指定目录下所有Jar中的重复类的Jar
show-duplicate-java-classes path/to/lib_dir1 /path/to/lib_dir2 -c path/to/class_dir1 -c path/to/class_dir2

# 帮助信息
$ show-duplicate-java-classes -h
Usage: show-duplicate-java-classes [-c class-dir1 [-c class-dir2] ...] [lib-dir1|jar-file1 [lib-dir2|jar-file2] ...]

Options:
  -h, --help            show this help message and exit
  -c CLASS_DIRS, --class-dir=CLASS_DIRS
                        add class dir
JDK开发场景使用说明
以Maven作为构建工程示意过程。
对于一般的工程
# 在项目模块目录下执行,拷贝依赖Jar到目录target/dependency下
$ mvn dependency:copy-dependencies -DincludeScope=runtime
...
# 检查重复类
$ show-duplicate-java-classes target/dependency
...
对于Web工程
对于Web工程,即war maven模块,会打包生成war文件。
# 在war模块目录下执行,生成war文件
$ mvn install
...
# 解压war文件,war文件中包含了应用的依赖的Jar文件
$ unzip target/*.war -d target/war
...
# 检查重复类
$ show-duplicate-java-classes -c target/war/WEB-INF/classes target/war/WEB-INF/lib
...
Android开发场景使用说明
Android开发,有重复类在编译打包时会报[Dex Loader] Unable to execute dex: Multiple dex files define Lorg/foo/xxx/Yyy。
但只会给出一个重复类名,如果重复类比较多时,上面打包/报错/排查会要进行多次,而Android的打包比较费时,这个过程比较麻烦,希望可以一次把所有重复类都列出来,一起排查掉。
以Gradle作为构建工程示意过程。
在App的build.gradle中添加拷贝库到目录build/dependencies下。
task copyDependencies(type: Copy) {
    def dest = new File(buildDir, "dependencies")

    // clean dir
    dest.deleteDir()
    dest.mkdirs()

    // fill dir with dependencies
    from configurations.compile into dest
}
# 拷贝依赖
$ ./gradlew app:copyDependencies
...
# 检查重复类
$ show-duplicate-java-classes app/build/dependencies
...
示例
$ show-duplicate-java-classes WEB-INF/lib
COOL! No duplicate classes found!

================================================================================
class paths to find:
================================================================================
1  : WEB-INF/lib/sourceforge.spring.modules.context-2.5.6.SEC02.jar
2  : WEB-INF/lib/misc.htmlparser-0.0.0.jar
3  : WEB-INF/lib/normandy.client-1.0.2.jar
...

$ show-duplicate-java-classes -c WEB-INF/classes WEB-INF/lib
Found duplicate classes in below class path:
1  (293@2): WEB-INF/lib/sourceforge.spring-2.5.6.SEC02.jar WEB-INF/lib/sourceforge.spring.modules.orm-2.5.6.SEC02.jar
2  (2@3): WEB-INF/lib/servlet-api-3.0-alpha-1.jar WEB-INF/lib/jsp-api-2.1-rev-1.jar WEB-INF/lib/jstl-api-1.2-rev-1.jar
3  (104@2): WEB-INF/lib/commons-io-2.2.jar WEB-INF/lib/jakarta.commons.io-2.0.jar
4  (6@3): WEB-INF/lib/jakarta.commons.logging-1.1.jar WEB-INF/lib/commons-logging-1.1.1.jar WEB-INF/lib/org.slf4j.jcl104-over-slf4j-1.5.6.jar
5  (344@2): WEB-INF/lib/sourceforge.spring-2.5.6.SEC02.jar WEB-INF/lib/sourceforge.spring.modules.context-2.5.6.SEC02.jar
...

================================================================================
Duplicate classes detail info:
================================================================================
1  (293@2): WEB-INF/lib/sourceforge.spring-2.5.6.SEC02.jar WEB-INF/lib/sourceforge.spring.modules.orm-2.5.6.SEC02.jar
    1   org/springframework/orm/toplink/TopLinkTemplate$13.class
    2   org/springframework/orm/hibernate3/HibernateTemplate$24.class
    3   org/springframework/orm/jpa/vendor/HibernateJpaDialect.class
    4   org/springframework/orm/hibernate3/TypeDefinitionBean.class
    5   org/springframework/orm/hibernate3/SessionHolder.class
    ...
2  (2@3): WEB-INF/lib/servlet-api-3.0-alpha-1.jar WEB-INF/lib/jsp-api-2.1-rev-1.jar WEB-INF/lib/jstl-api-1.2-rev-1.jar
    1   javax/servlet/ServletException.class
    2   javax/servlet/ServletContext.class
3  (104@2): WEB-INF/lib/commons-io-2.2.jar WEB-INF/lib/jakarta.commons.io-2.0.jar
    1   org/apache/commons/io/input/ProxyReader.class
    2   org/apache/commons/io/output/FileWriterWithEncoding.class
    3   org/apache/commons/io/output/TaggedOutputStream.class
    4   org/apache/commons/io/filefilter/NotFileFilter.class
    5   org/apache/commons/io/filefilter/TrueFileFilter.class
    ...
...

================================================================================
class paths to find:
================================================================================
1  : WEB-INF/lib/sourceforge.spring.modules.context-2.5.6.SEC02.jar
2  : WEB-INF/lib/misc.htmlparser-0.0.0.jar
3  : WEB-INF/lib/normandy.client-1.0.2.jar
4  : WEB-INF/lib/xml.xmlgraphics__batik-css-1.7.jar-1.7.jar
5  : WEB-INF/lib/jakarta.ecs-1.4.2.jar
...
贡献者
tgic提供此脚本。友情贡献者的链接 commandlinefu.cn | 微博linux命令行精选
🍺 find-in-jars
在当前目录下所有jar文件里,查找类或资源文件。
支持Linux、Mac、Windows(cygwin、MSSYS)。
用法
# 在当前目录下所有`jar`文件里,查找类或资源文件。
find-in-jars 'log4j\.properties'
find-in-jars 'log4j\.xml$'
find-in-jars log4j\\.xml$ # 和上面命令一样,Shell转义的不同写法而已
find-in-jars 'log4j\.(properties|xml)$'
# -d选项 指定 查找目录(覆盖缺省的当前目录)
find-in-jars 'log4j\.properties$' -d /path/to/find/directory
# 支持多个查找目录,多次指定这个选项即可
find-in-jars 'log4j\.properties' -d /path/to/find/directory1 -d /path/to/find/directory2
# -e选项 指定 查找`zip`文件的扩展名,缺省是`jar`
find-in-jars 'log4j\.properties' -e zip
# 支持多种查找扩展名,多次指定这个选项即可
find-in-jars 'log4j\.properties' -e jar -e zip
# -a选项 指定 查找结果中的Jar文件使用绝对路径
# 分享给别人时,Jar文件路径是完整的,方便别人找到文件
find-in-jars 'log4j\.properties' -a
# -s选项 指定 查找结果中的Jar文件和Jar文件里的查找Entry间分隔符,缺省是『!』
# 方便你喜欢的人眼查看,或是与工具脚本如`awk`的处理
find-in-jars 'log4j\.properties' -s ' <-> '
find-in-jars 'log4j\.properties' -s ' ' | awk '{print $2}'
# 帮助信息
$ find-in-jars -h
Usage: find-in-jars [OPTION]... PATTERN
Find files in the jar files under specified directory,
search jar files recursively(include subdirectory).
The pattern default is *extended* regex.
Example:
find-in-jars 'log4j\.properties'
# search file log4j.properties/log4j.xml at zip root
find-in-jars '^log4j\.(properties|xml)$'
find-in-jars 'log4j\.properties$' -d /path/to/find/directory
find-in-jars '\.properties$' -d /path/to/find/dir1 -d path/to/find/dir2
find-in-jars 'Service\.class$' -e jar -e zip
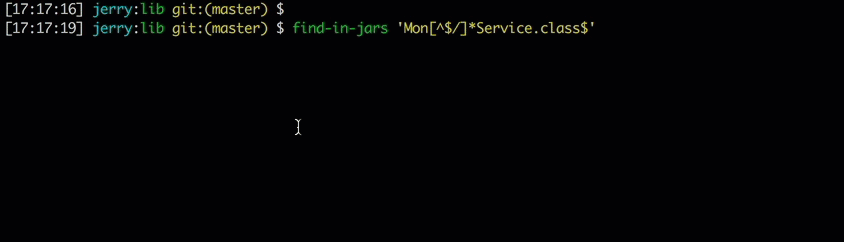
find-in-jars 'Mon[^$/]*Service\.class$' -s ' <-> '
Find control:
-d, --dir the directory that find jar files.
default is current directory. this option can specify
multiply times to find in multiply directories.
-e, --extension set find file extension, default is jar. this option
can specify multiply times to find multiply extension.
-E, --extended-regexp PATTERN is an extended regular expression (*default*)
-F, --fixed-strings PATTERN is a set of newline-separated strings
-G, --basic-regexp PATTERN is a basic regular expression
-P, --perl-regexp PATTERN is a Perl regular expression
-i, --ignore-case ignore case distinctions
Output control:
-a, --absolute-path always print absolute path of jar file
-s, --separator specify the separator between jar file and zip entry.
default is `!'.
Miscellaneous:
-h, --help display this help and exit
注意,Pattern缺省是grep的 扩展正则表达式。
示例
# 在当前目录下的所有Jar文件中,查找出 log4j.properties文件
$ find-in-jars 'log4j\.properties$'
./hadoop-core-0.20.2-cdh3u3.jar!log4j.properties

# 查找出 以Service结尾的类,Jar文件路径输出成绝对路径
$ find-in-jars 'Service.class$' -a
/home/foo/deploy/app/WEB-INF/libs/spring-2.5.6.SEC03.jar!org/springframework/stereotype/Service.class
/home/foo/deploy/app/WEB-INF/libs/rpc-hello-0.0.1-SNAPSHOT.jar!com/taobao/biz/HelloService.class
......

# 在指定的多个目录的Jar文件中,查找出 properties文件
$ find-in-jars '\.properties$' -d WEB-INF/lib -d ../deploy/lib | grep -v '/pom\.properties$'
WEB-INF/lib/aspectjtools-1.6.2.jar!org/aspectj/ajdt/ajc/messages.properties
WEB-INF/lib/aspectjweaver-1.8.8.jar!org/aspectj/weaver/XlintDefault.properties
../deploy/lib/groovy-all-1.1-rc-1.jar!groovy/ui/InteractiveShell.properties
../deploy/lib/httpcore-4.3.3.jar!org/apache/http/version.properties
../deploy/lib/javax.servlet-api-3.0.1.jar!javax/servlet/http/LocalStrings_es.properties
......
运行效果
支持彩色输出,文件名中的匹配部分以grep的高亮方式显示。
参考资料
相关文章
- Java描述设计模式(10):组合模式
- Java环境配置(linux安装jdk8)
- Idea:Java文件打包可执行的JAR文件,并指定JDK编译版本
- 回归JAVA: java文件编译后,出现xx$1.class的原因
- 【java细节】Java代码忽略https证书:No subject alternative names present
- 最新秋招,Java八股文!含答案,JAVA核心知识点最详细版(面试必备)
- Linux后台运行java的jar包
- Java关闭Socket来终止线程
- Java 设计模式之桥接模式,Java 桥接模式 ,java Bridge Pattern
- Java线程锁,synchronized、wait、notify详解--java 管程
- java安全编码指南之:敏感类的拷贝
- Java_动态编译总结
- Java_Java中动态加载jar文件和class文件
- Java_java动态编译整个项目,解决jar包找不到问题
- Java HashSet和LinkedHashSet的用法
- Ubuntu 14.04 & ant: Unable to locate tools.jar. Expected to find it in /usr/lib/jvm/java-7-openjdk-i386/lib/tools.jar
- 华为OD机试 -数字加减游戏(Java) | 机试题+算法思路+考点+代码解析 【2023】
- java导出excel不须要额外jar包
- java中的Turtrel总结
- 用JSmooth制作java jar文件的可运行exe文件教程【图文】
- Java开发 - 消息队列之Kafka初体验
- java jar包收集
- 记一次未解决的异常:java.lang.NoClassDefFoundError: net/sf/json/JSONObject
- IDEA创建java项目并打包成jar包
- Java中java.util.Arrays参考指南
- 【Java I/O 流】文件的操作——java.io.File 类详解