
Python的N种性能测试工具(timeit、profile、cProfile、line_profiler、memory_profiler、objgraph、Pyinstrument、PyCharm)
2023-09-11 14:15:15 时间
1、timeit
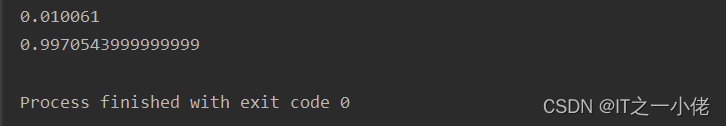
timeit只输出被测试代码的总运行时间,单位为秒,没有详细的统计。
示例代码:
import timeit


def fun():
    lst = []
    for i in range(100000):
        lst.append(i * i)


print(timeit.timeit('fun()', 'from __main__ import fun', number=1))
print(timeit.timeit('fun()', 'from __main__ import fun', number=100))
运行结果:
2、profile
profile:纯Python实现的性能测试模块,接口和cProfile一样。
示例代码:
import profile


def fun():
    lst = []
    for i in range(100000):
        lst.append(i * i)


print(profile.run('fun()'))
运行结果:
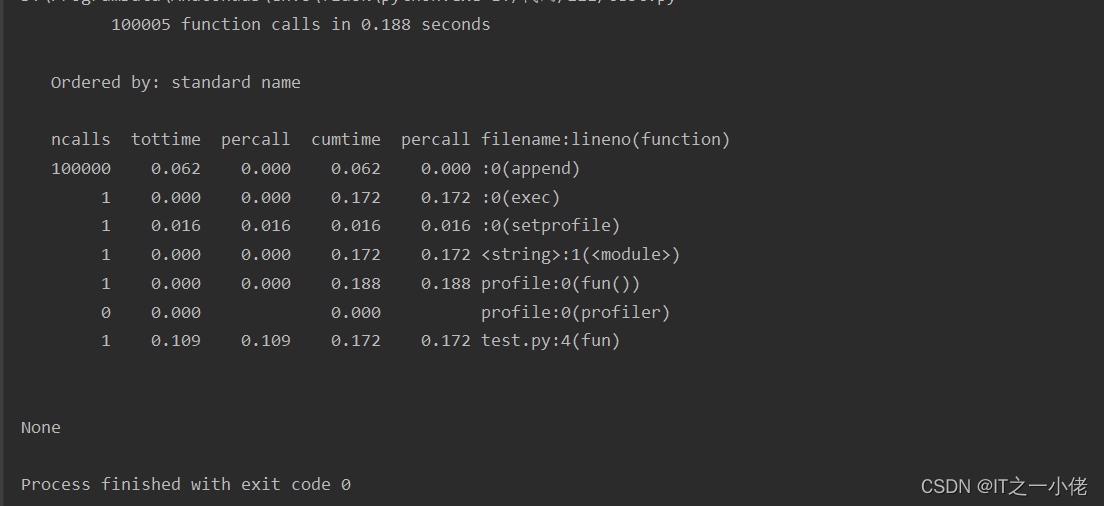
参数解析:
- ncall:函数运行次数
- tottime: 函数的总的运行时间,减去函数中调用子函数的运行时间
- 第一个percall:percall = tottime / nclall
- cumtime:函数及其所有子函数调整的运行时间,也就是函数开始调用到结束的时间。
- 第二个percall:percall = cumtime / nclall
3、cProfile
c语言实现的性能测试模块,接口和profile一样。
示例代码:
import cProfile


def fun():
    lst = []
    for i in range(100000):
        lst.append(i * i)


print(cProfile.run('fun()'))
运行结果:
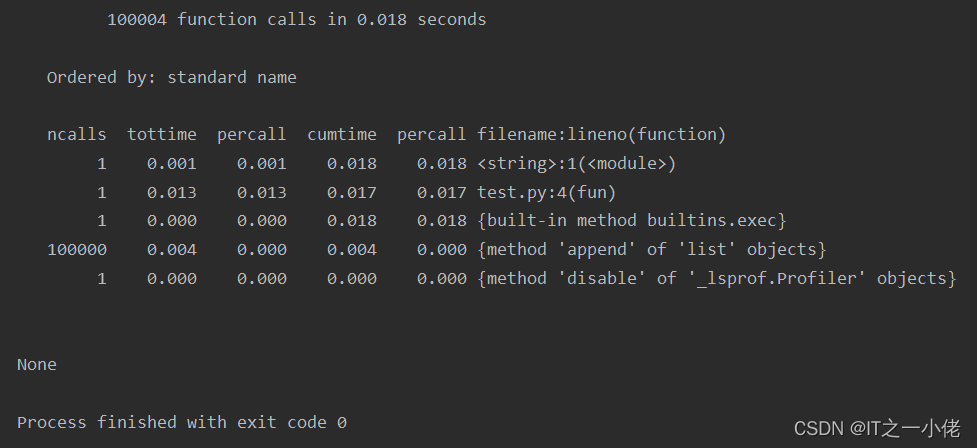
参数解析:
ncalls、tottime、percall、cumtime含义同profile。
4、line_profiler
略
5、memory_profiler
略
6、objgraph
略
7、Pyinstrument
详见博文:python中代码性能分析Pyinstrument库_IT之一小佬的博客-CSDN博客
8、PyCharm图形化性能测试工具
详见博文:PyCharm的Profile工具进行python代码性能分析_IT之一小佬的博客-CSDN博客
参考博文:
相关文章
- How to run python interactive in current file's directory in Visual Studio Code? Python路径问题
- python 保存图片_用Python从视频中提取每一帧的图片
- 5分钟教会你用Python采集CSDN的热榜
- 【Python】自动化抢勾,python软件安装教程
- python获取环境变量中的值(Pycharm)
- 零基础自学Python需要多长时间从入门到精通?学python能兼职挣钱吗?怎么挣钱?
- python面对对象-使用@property
- gyp ERR! stack Error: Can‘t find Python executable “python“, you can set the PYTHON env variable.
- Python中int、str、bytes相互转化,还有2进制、16进制表示,你想要的都在这里了
- python学习之OpenCV-Python模块的部分应用示例(生成素描图和动漫图)
- python Python程序的架构
- Python编辑器(PyCharm)超详细安装教程
- Python Kivy安装及使用PyCharm进行简单测试(讲解如何参照kivy官方说明安装测试)
- 华为OD机试 - 连续子串(Python) | 机试题+算法思路+考点+代码解析 【2023】
- Python 基础 之 Pycharm 实现简单的名片管理系统
- Ubuntu安装python
- 记录python接口自动化测试--pycharm执行测试用例时需要使用的姿势(解决if __name__ == "__main__":里面的程序不生效的问题)(第三目)
- 【python百度智能云】:Python — 三种获取__VIEWSTATE、__VIEWSTATEGENERATOR、__EVENTVALIDATION方法。
- Python 创建和使用类