
Google earth engine(GEE)——LANDSAT8统计不同点的DN值
这次使用到的工具:
ui.Chart.image.regions(image, regions, reducer, scale, seriesProperty, xLabels)
和上次的.byregions不同下面黄色部分
Generates a Chart from an image. Extracts and plots the value of each band in one or more regions.
- X-axis = Band labeled by xProperty (default: band name).
- Y-axis = Reducer output.
- Series = Region labeled by seriesProperty (default: 'system:index').
系列 = 由 seriesProperty 标记的区域(默认值:'system:index')属性值不同,主要是标记的点来进行属性添加的。Returns a chart.
Arguments:
image (Image):
Image to extract band values from.
regions (Feature|FeatureCollection|Geometry|List<Feature>|List<Geometry>, optional):
Regions to reduce. Defaults to the image's footprint.
reducer (Reducer, optional):筛选器产生一个单个波段的值作为Y轴的值
Reducer that generates the value(s) for the y-axis. Must return a single value per band.
scale (Number, optional):
The pixel scale in meters.
seriesProperty (String, optional):
用作图例中每个区域标签的属性。默认为“系统:索引”
Property to be used as the label for each region in the legend. Defaults to 'system:index'.
xLabels (List<Object>, optional):
A list of labels used for bands on the x-axis. Must have the same number of elements as the image bands. If omitted, bands will be labeled with their names. If the labels are numeric (e.g. wavelengths), x-axis will be continuous.
Returns: ui.Chart

看代码:
var landsat8Toa = ee.ImageCollection('LANDSAT/LC08/C01/T1_TOA');
//设定一个变量三个颜色,一会分别作为三个点显示的颜色
var COLOR = {
PARK: 'ff0000',
FARM: '0000ff',
URBAN: '00ff00'
};
// 设置三个你想知道的点,并且把label作为其中的legend图例 Three known locations.
var park = ee.Feature(
ee.Geometry.Point(-99.25260, 19.32235), {'label': 'park'});
var farm = ee.Feature(
ee.Geometry.Point(-99.08992, 19.27868), {'label': 'farm'});
var urban = ee.Feature(
ee.Geometry.Point(-99.21135, 19.31860), {'label': 'urban'});
//设置点的集合作为矢量点图层
var mexicoPoints = ee.FeatureCollection([park, farm, urban]);
landsat8Toa = landsat8Toa.filterBounds(mexicoPoints);
//选取第一幅影像
var mexicoImage = ee.Image(landsat8Toa.first());
// 选取波段可以这么选省下一个个写,Select bands B1 to B7.
mexicoImage = mexicoImage.select(['B[1-7]']);
//这个就是根据你的矢量无论是点还是面还是线,一般都是通过region来进行图形的显示
var bandChart = ui.Chart.image.regions({
image: mexicoImage,
regions: mexicoPoints,
scale: 30,
seriesProperty: 'label'
});
//设置你的图像显示,本次选择是线性图
bandChart.setChartType('LineChart');
//设置你的图上的属性,设置横纵轴和标题,线宽和点的大小
bandChart.setOptions({
title: 'Landsat 8 TOA band values at three points near Mexico City',
hAxis: {
title: 'Band'
},
vAxis: {
title: 'Reflectance'
},
lineWidth: 1,
pointSize: 4,
series: {
0: {color: COLOR.PARK},
1: {color: COLOR.FARM},
2: {color: COLOR.URBAN}
}
});
// From: https://landsat.usgs.gov/what-are-best-spectral-bands-use-my-study最佳光谱值通过官网提供的,自己可以查询
var wavelengths = [.44, .48, .56, .65, .86, 1.61, 2.2];
//这个是光谱的值图像显示seriesProperty就是你的图例,label对应的键值
var spectraChart = ui.Chart.image.regions({
image: mexicoImage,
regions: mexicoPoints,
scale: 30,
seriesProperty: 'label',
xLabels: wavelengths
});
spectraChart.setChartType('LineChart');
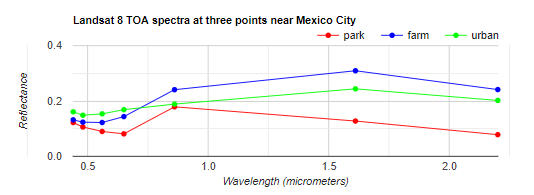
spectraChart.setOptions({
title: 'Landsat 8 TOA spectra at three points near Mexico City',
hAxis: {
title: 'Wavelength (micrometers)'//()中代表你的单位
},
vAxis: {
title: 'Reflectance'
},
lineWidth: 1,
pointSize: 4,
series: {
0: {color: COLOR.PARK},
1: {color: COLOR.FARM},
2: {color: COLOR.URBAN}
}
});
//最后打印两个图表
print(bandChart);
print(spectraChart);
Map.addLayer(park, {color: COLOR.PARK});
Map.addLayer(farm, {color: COLOR.FARM});
Map.addLayer(urban, {color: COLOR.URBAN});
Map.setCenter(-99.25260, 19.32235, 11);
三个点的信息分别代表市区、城中心和农场

相关文章
- Android网络之数据解析----使用Google Gson解析Json数据
- [Docker] Storing Container Data in Google Cloud Storage
- [io PWA] keynote: Launching a Progressive Web App on Google.com
- Google 和 Facebook 如何大规模处理 IT 事件管理 —— 2016 SRE 大会之我见
- Google浏览器中的开发工具.
- Colaboratory:手把手教你使用Google免费的云端IDE进行深度学习(免费的GPU加速)的详细攻略
- 从Google Quick Draw涂鸦观察不同文化属性
- 谷歌google搜索打不开、谷歌gmail邮箱及相关服务无法登录的解决的方法
- 详解Google第二代TPU 既能推理又能训练 性能霸道