
Aspose.Words使用教程之如何使用ChartDataLabel
教程 如何 words Aspose 使用
2023-09-11 14:14:49 时间
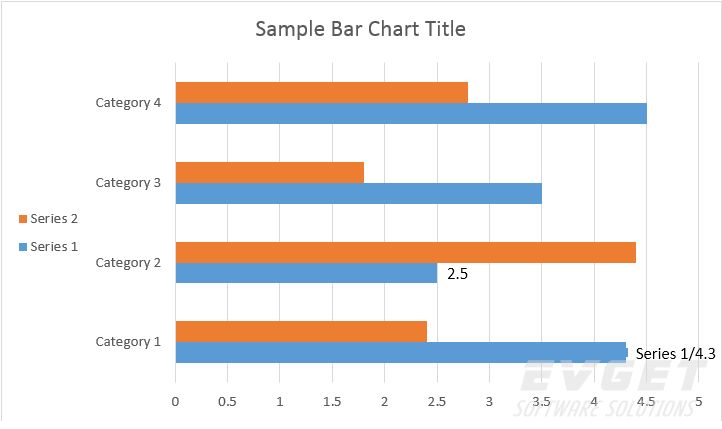
使用ChartDataLabel你可以规定单个图表系列的数据标签的格式,像显现/隐藏图例、种类名字、SeriesName、值等等。
立即下载Aspose.Words最新版![]() http://www.evget.com/product/564
http://www.evget.com/product/564
C#
ChartDataLabelCollection dataLabelCollection = series0.DataLabels;

// Add data label to the first and second point of the first series.
ChartDataLabel chartDataLabel00 = dataLabelCollection.Add(0);
ChartDataLabel chartDataLabel01 = dataLabelCollection.Add(1);

// Set properties.
chartDataLabel00.ShowLegendKey = true;

// By default, when you add data labels to the data points in a pie chart, leader lines are displayed for data labels that are
// positioned far outside the end of data points. Leader lines create a visual connection between a data label and its
// corresponding data point.
chartDataLabel00.ShowLeaderLines = true;

chartDataLabel00.ShowCategoryName = false;
chartDataLabel00.ShowPercentage = false;
chartDataLabel00.ShowSeriesName = true;
chartDataLabel00.ShowValue = true;
chartDataLabel00.Separator = "/";

chartDataLabel01.ShowValue = true;
Visual Basic
Dim dataLabelCollection As ChartDataLabelCollection = series0.DataLabels

' Add data label to the first and second point of the first series.
Dim chartDataLabel00 As ChartDataLabel = dataLabelCollection.Add(0)
Dim chartDataLabel01 As ChartDataLabel = dataLabelCollection.Add(1)

' Set properties.
chartDataLabel00.ShowLegendKey = True

' By default, when you add data labels to the data points in a pie chart, leader lines are displayed for data labels that are
' positioned far outside the end of data points. Leader lines create a visual connection between a data label and its
' corresponding data point.
chartDataLabel00.ShowLeaderLines = True

chartDataLabel00.ShowCategoryName = False
chartDataLabel00.ShowPercentage = False
chartDataLabel00.ShowSeriesName = True
chartDataLabel00.ShowValue = True
chartDataLabel00.Separator = "/"

chartDataLabel01.ShowValue = True
结果如下:
相关文章
- Word控件Spire.Doc 【文本】教程(11) ;如何将文本分成两列并在它们之间添加行
- Word控件Spire.Doc 转换教程(八):如何在 C#、VB.NET 中将 RTF 转换为 HTML
- Aspose.Words使用教程之如何在文档中添加水印
- Aspose.Words使用教程之如何重命名合并字段
- Aspose.Words使用教程之如何写入纯文本(TXT)文件
- Aspose.Words for .NET使用教程——如何替换或修改超链接
- Aspose.Words for .NET样式处理教程——如何插入和使用目录字段
- Aspose.Words for .NET使用章节教程(2):如何处理文档分段——Aspose.Words中的分段
- Aspose.Words for .NET使用章节教程(1):如何处理文档分段——Microsoft Word中的分段
- Aspose.Words for .NET使用文档教程(8):如何获取字体行间距
- Aspose.Words for .NET使用文档教程(7):如何提取目录和设置导入格式选项
- Aspose.Words for .NET使用文档教程(4):如何比较两个Word文档
- 地球引擎高级教程——大型项目如何在脚本之间共享代码?(划分格网)
- 【MATLAB教程案例63】学习如何建立自己的深度学习训练样本库,包括分类识别数据库和目标检测数据库
- 最详细Postman参数化详细教程,精心整理
- 《Redis官方教程》- 事件库
- Xamarin Android教程如何使用Xamarin开发Android应用
- 《Adobe Flash CS6中文版经典教程》——1.10 修改内容和舞台
- SwiftUI 内功之整合腾讯地图map实现地图导览卫星路况手绘大头钉合集 在Swift中使用Objective-C类(教程含源码)
- SwiftUI 教程之 如何显示unicode特殊符号 (教程含源码)
- SwiftUI 中级List如何添加新内容(2020年教程)
- SwiftUI 如何打开本地文件和远程iCloud云存储文件(教程含代码)
- Flutter 教程之如何将 Flutter 连接到 PHP(教程含源码)
- SwiftUI 内功之如何在Swift中检查对象是否为给定类型 (教程含源码)
- macOS SwiftUI 字段和标签组件规范之 02 标签Labels(教程含源码)
- SwiftUI AVFoundation教程之 汇总大全帖
- macOS SwiftUI 教程之 文本编辑器 (教程含源码)
- SwiftUI macos 教程之如何设置TextView行间距(教程含源码)
- Excel 数据透视表教程大全之 04 按日期分组(教程含样本数据)
- JS教程之如何在 JavaScript 中添加、更新和删除 JSON 数组 - CRUD
- 《数据库技术原理与应用教程(第2版)》——本章小结
- 【Redis】01-如何在Linux下安装Reids保姆级教程
- 如何在手机中标注图形角度?CAD角度标注教程
- CAD看图软件中如何测量弧长?CAD测量弧长教程
- 如何在CAD软件中定义设备表?CAD定义设备表教程