
Aspose.Words使用教程之从零创建OOXML图表
教程 创建 图表 words Aspose 使用
2023-09-11 14:14:49 时间
文档类已经添加进了新的插入图表方法,所以,让我们看看如何使用DocumentBuilder.InsertChart方法将一个简单的列图表插入到文档。
aspose.words最新下载![]() https://www.evget.com/product/564/download如下所示:
https://www.evget.com/product/564/download如下所示:
C#
Document doc = new Document();
DocumentBuilder builder = new DocumentBuilder(doc);

// Add chart with default data. You can specify different chart types and sizes.
Shape shape = builder.InsertChart(ChartType.Column, 432, 252);

// Chart property of Shape contains all chart related options.
Chart chart = shape.Chart;

// Get chart series collection.
ChartSeriesCollection seriesColl = chart.Series;

// Delete default generated series.
seriesColl.Clear();

// Create category names array, in this example we have two categories.
string[] categories = new string[] { "AW Category 1", "AW Category 2" };

// Adding new series. Please note, data arrays must not be empty and arrays must be the same size.
seriesColl.Add("AW Series 1", categories, new double[] { 1, 2 });
seriesColl.Add("AW Series 2", categories, new double[] { 3, 4 });
seriesColl.Add("AW Series 3", categories, new double[] { 5, 6 });
seriesColl.Add("AW Series 4", categories, new double[] { 7, 8 });
seriesColl.Add("AW Series 5", categories, new double[] { 9, 10 });

doc.Save(MyDir + @"TestInsertChartColumn.docx");
Visual Basic
Dim doc As New Document()
Dim builder As New DocumentBuilder(doc)

' Add chart with default data. You can specify different chart types and sizes.
Dim shape As Shape = builder.InsertChart(ChartType.Column, 432, 252)

' Chart property of Shape contains all chart related options.
Dim chart As Chart = shape.Chart

' Get chart series collection.
Dim seriesColl As ChartSeriesCollection = chart.Series

' Delete default generated series.
seriesColl.Clear()

' Create category names array, in this example we have two categories.
Dim categories() As String = {"AW Category 1", "AW Category 2"}

' Adding new series. Please note, data arrays must not be empty and arrays must be the same size.
seriesColl.Add("AW Series 1", categories, New Double() {1, 2})
seriesColl.Add("AW Series 2", categories, New Double() {3, 4})
seriesColl.Add("AW Series 3", categories, New Double() {5, 6})
seriesColl.Add("AW Series 4", categories, New Double() {7, 8})
seriesColl.Add("AW Series 5", categories, New Double() {9, 10})

doc.Save(MyDir & "TestInsertChartColumn.docx")
这段代码会产生如下结果:
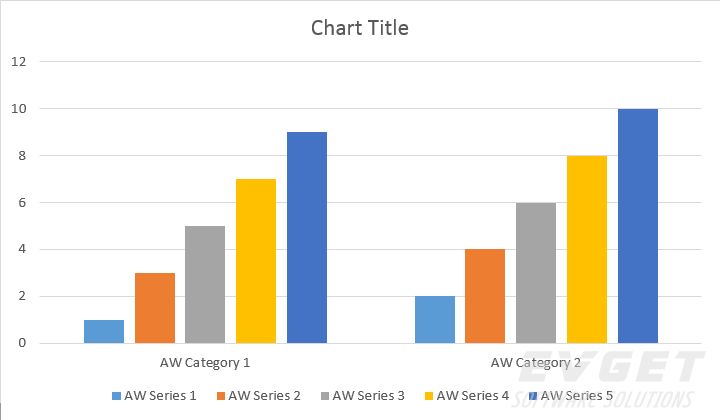
有四种不同的加载添加方法:
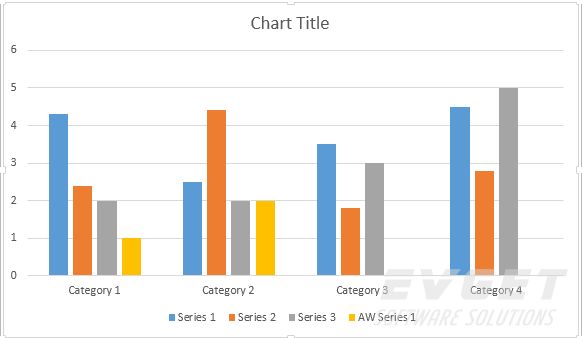
1.插入列图表
C#
Document doc = new Document();
DocumentBuilder builder = new DocumentBuilder(doc);

// Insert Column chart.
Shape shape = builder.InsertChart(ChartType.Column, 432, 252);
Chart chart = shape.Chart;

// Use this overload to add series to any type of Bar, Column, Line and Surface charts.
chart.Series.Add("AW Series 1", new string[] { "AW Category 1", "AW Category 2" }, new double[] { 1, 2 });

doc.Save(MyDir + @"TestInsertColumnChart.docx");
Visual Basic
Dim doc As New Document()
Dim builder As New DocumentBuilder(doc)

' Insert Column chart.
Dim shape As Shape = builder.InsertChart(ChartType.Column, 432, 252)
Dim chart As Chart = shape.Chart

' Use this overload to add series to any type of Bar, Column, Line and Surface charts.
chart.Series.Add("AW Series 1", New string() { "AW Category 1", "AW Category 2" }, New Double() { 1, 2 })

doc.Save(MyDir & "TestInsertColumnChart.docx")
结果如下:
2.插入散点图
C#
Document doc = new Document();
DocumentBuilder builder = new DocumentBuilder(doc);

// Insert Scatter chart.
Shape shape = builder.InsertChart(ChartType.Scatter, 432, 252);
Chart chart = shape.Chart;

// Use this overload to add series to any type of Scatter charts.
chart.Series.Add("AW Series 1", new double[] { 0.7, 1.8, 2.6 }, new double[] { 2.7, 3.2, 0.8 });

doc.Save(MyDir + @"TestInsertScatterChart.docx");
Visual Basic
Dim doc As New Document()
Dim builder As New DocumentBuilder(doc)

' Insert Scatter chart.
Dim shape As Shape = builder.InsertChart(ChartType.Scatter, 432, 252)
Dim chart As Chart = shape.Chart

' Use this overload to add series to any type of Scatter charts.
chart.Series.Add("AW Series 1", New Double() {0.7, 1.8, 2.6}, New Double() {2.7, 3.2, 0.8})

doc.Save(MyDir & "TestInsertScatterChart.docx")
结果如下:

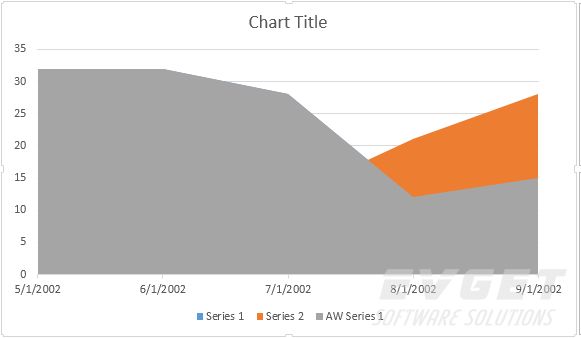
3.插入面积图
C#
Document doc = new Document();
DocumentBuilder builder = new DocumentBuilder(doc);

// Insert Area chart.
Shape shape = builder.InsertChart(ChartType.Area, 432, 252);
Chart chart = shape.Chart;

// Use this overload to add series to any type of Area, Radar and Stock charts.
chart.Series.Add("AW Series 1", new DateTime[] {
new DateTime(2002, 05, 01),
new DateTime(2002, 06, 01),
new DateTime(2002, 07, 01),
new DateTime(2002, 08, 01),
new DateTime(2002, 09, 01)}, new double[] { 32, 32, 28, 12, 15 });

doc.Save(MyDir + @"TestInsertAreaChart.docx");
Visual Basic
Dim doc As New Document()
Dim builder As New DocumentBuilder(doc)

' Insert Area chart.
Dim shape As Shape = builder.InsertChart(ChartType.Area, 432, 252)
Dim chart As Chart = shape.Chart

' Use this overload to add series to any type of Area, Radar and Stock charts.
chart.Series.Add("AW Series 1", New DateTime() {New DateTime(2002, 5, 1), New DateTime(2002, 6, 1), New DateTime(2002, 7, 1), New DateTime(2002, 8, 1), New DateTime(2002, 9, 1)}, New Double() {32, 32, 28, 12, 15})

doc.Save(MyDir & "TestInsertAreaChart.docx")
结果如下:
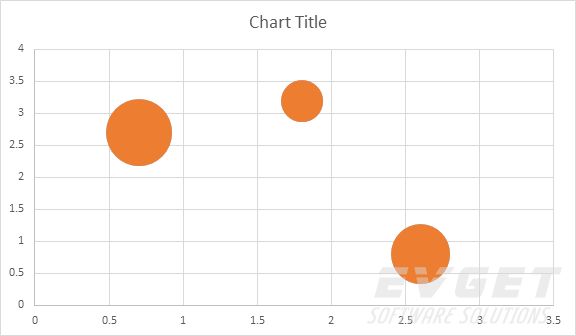
4.插入气泡式图表
C#
Document doc = new Document();
DocumentBuilder builder = new DocumentBuilder(doc);

// Insert Bubble chart.
Shape shape = builder.InsertChart(ChartType.Bubble, 432, 252);
Chart chart = shape.Chart;

// Use this overload to add series to any type of Bubble charts.
chart.Series.Add("AW Series 1", new double[] { 0.7, 1.8, 2.6 }, new double[] { 2.7, 3.2, 0.8 }, new double[] { 10, 4, 8 });

doc.Save(MyDir + @"TestInsertBubbleChart.docx");
Visual Basic
Dim doc As New Document()
Dim builder As New DocumentBuilder(doc)

' Insert Bubble chart.
Dim shape As Shape = builder.InsertChart(ChartType.Bubble, 432, 252)
Dim chart As Chart = shape.Chart

' Use this overload to add series to any type of Bubble charts.
chart.Series.Add("AW Series 1", New Double() {0.7, 1.8, 2.6}, New Double() {2.7, 3.2, 0.8}, New Double() {10, 4, 8})

doc.Save(MyDir & "TestInsertBubbleChart.docx")
结果如下:
相关文章
- Golang Gateway API 搭建教程
- 3ds Max光照纹理导入Unity的教程.
- SQLite使用教程4 创建数据库
- Git使用教程,从入门到上瘾
- python使用matplotlib绘制折线图教程
- 【学习总结】Git学习-参考廖雪峰老师教程三-创建版本库
- LNMP平滑升级nginx并安装ngx_lua模块教程
- 【REACT NATIVE 系列教程之二】创建自定义组件&&导入与使用示例
- SPSS详细教程:OR值的计算
- CSS教程:div垂直居中的N种方法[转]
- SAP UI5 应用开发教程之三十二 - 如何创建一个自定义 SAP UI5 控件试读版
- SAP系统和微信集成的系列教程之三:微信用户关注公众号之后,自动在SAP C4C系统创建客户主数据
- 家政服务小程序实战教程02-创建模型应用
- AOS编排语言系列教程(四):创建弹性云服务器ECS
- AOS编排语言系列教程(六):创建共享云硬盘EVS
- RabbitMQ安装教程
- Docker系列教程05 容器常用命令
- [译]Vulkan教程(22)创建顶点buffer
- verilog教程
- MySql-8.0.12 安装教程
- webstorm-前端javascript开发神器中文教程和技巧分享(转)
- VS+Qt — Vistual Studio 2022+Qt6安装教程以及解决Qt Vistual Studio Tools下载慢和VS无法打开.ui进行设计的问题