
ChartControl 折线图 柱状图
https://documentation.devexpress.com/#WindowsForms/CustomDocument8117
添加折线图(柱状图)
拖动ChartControl到Form上
在Series Collection中添加Line(或Bar)
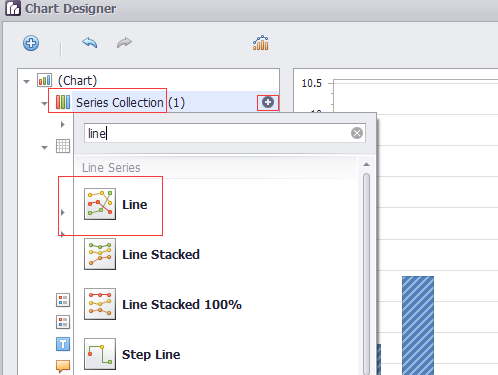
DevExpress.XtraCharts.Series series1 = new DevExpress.XtraCharts.Series();
   DevExpress.XtraCharts.LineSeriesView lineSeriesView1 = new DevExpress.XtraCharts.LineSeriesView();

  series1.View = lineSeriesView1;
   this.chartControl1.SeriesSerializable = new DevExpress.XtraCharts.Series[] {
        series1,
        series2,
        series3,
        series4};
Legend
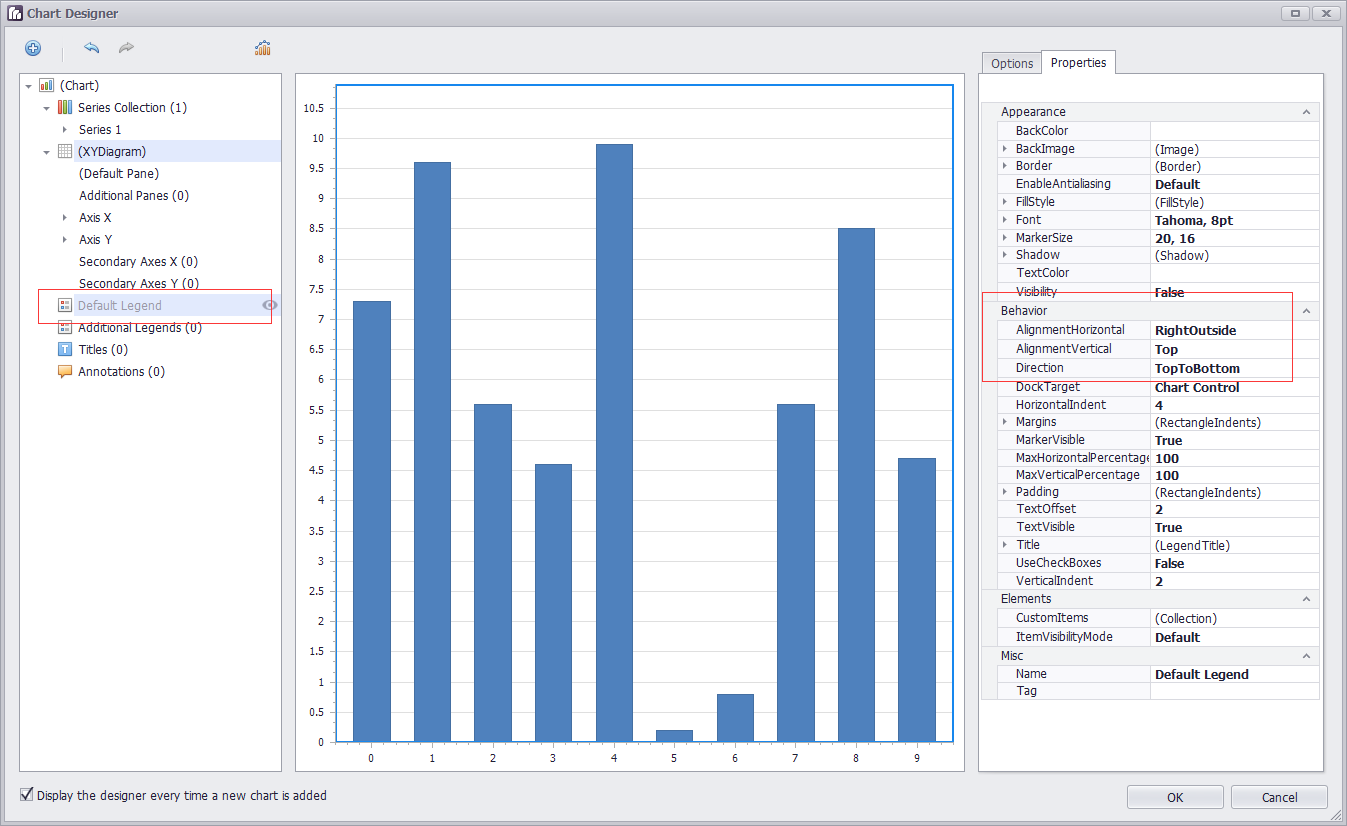
位置
AlignmentHorizontal 设置为Center
AlignmentVertical 设置为BottomOutside
Direction 设置为LeftToRight
  this.chartControl1.Legend.AlignmentHorizontal = DevExpress.XtraCharts.LegendAlignmentHorizontal.Center;
            this.chartControl1.Legend.AlignmentVertical = DevExpress.XtraCharts.LegendAlignmentVertical.BottomOutside;
            this.chartControl1.Legend.Direction = DevExpress.XtraCharts.LegendDirection.LeftToRight;
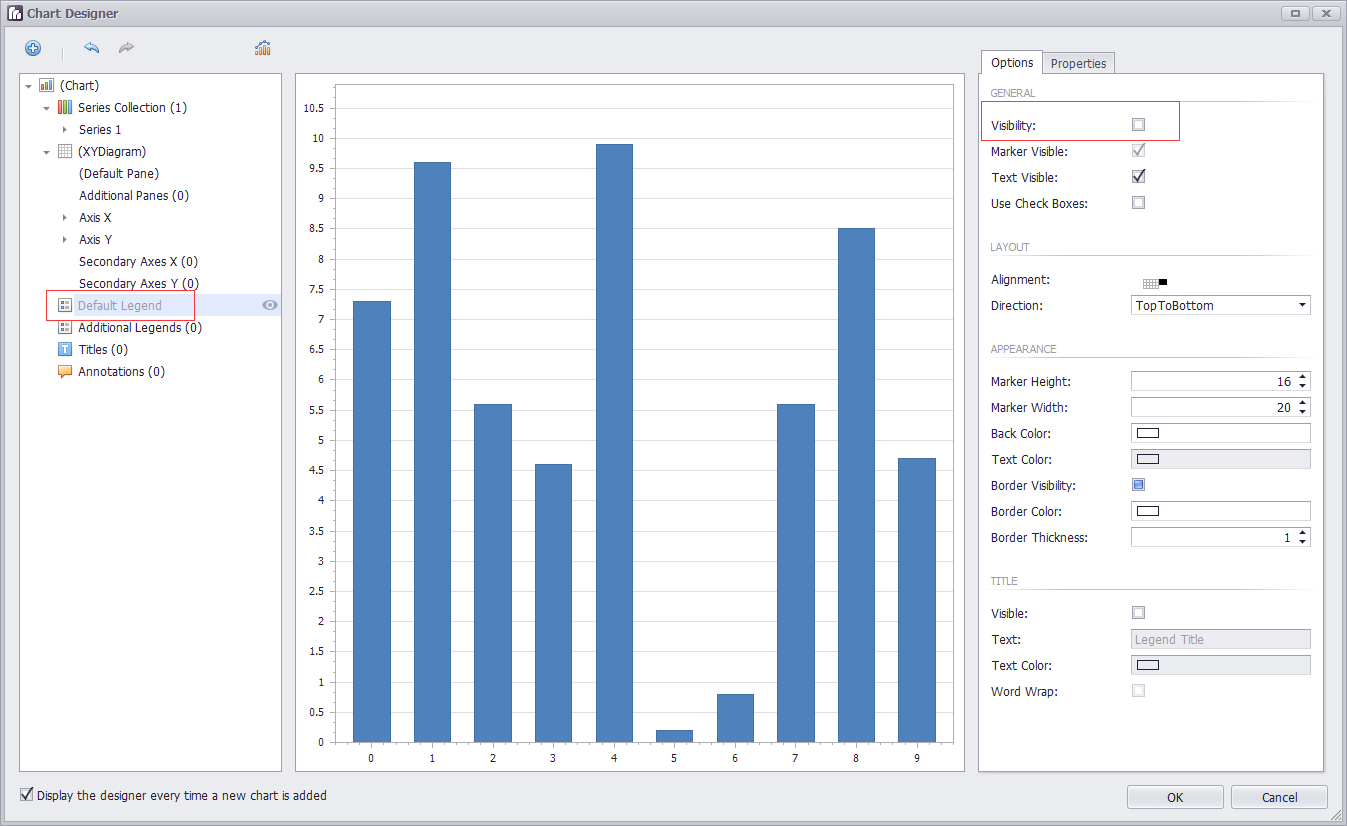
可见性
直接在界面上选中Legend,设置Visibility
曲线上的点显示
设置Marker Visibility
  series1.LegendText = "空调用电";
            series1.Name = "Series 1";
            lineSeriesView1.MarkerVisibility = DevExpress.Utils.DefaultBoolean.True;
调整: 可以直接设置series1.Name = "空调用电"; 这样的话,鼠标在悬浮的时候,显示某一列的数据时,对应曲线名字可以对应上。无需设置LegendText
坐标轴
https://documentation.devexpress.com/#WindowsForms/CustomDocument5779
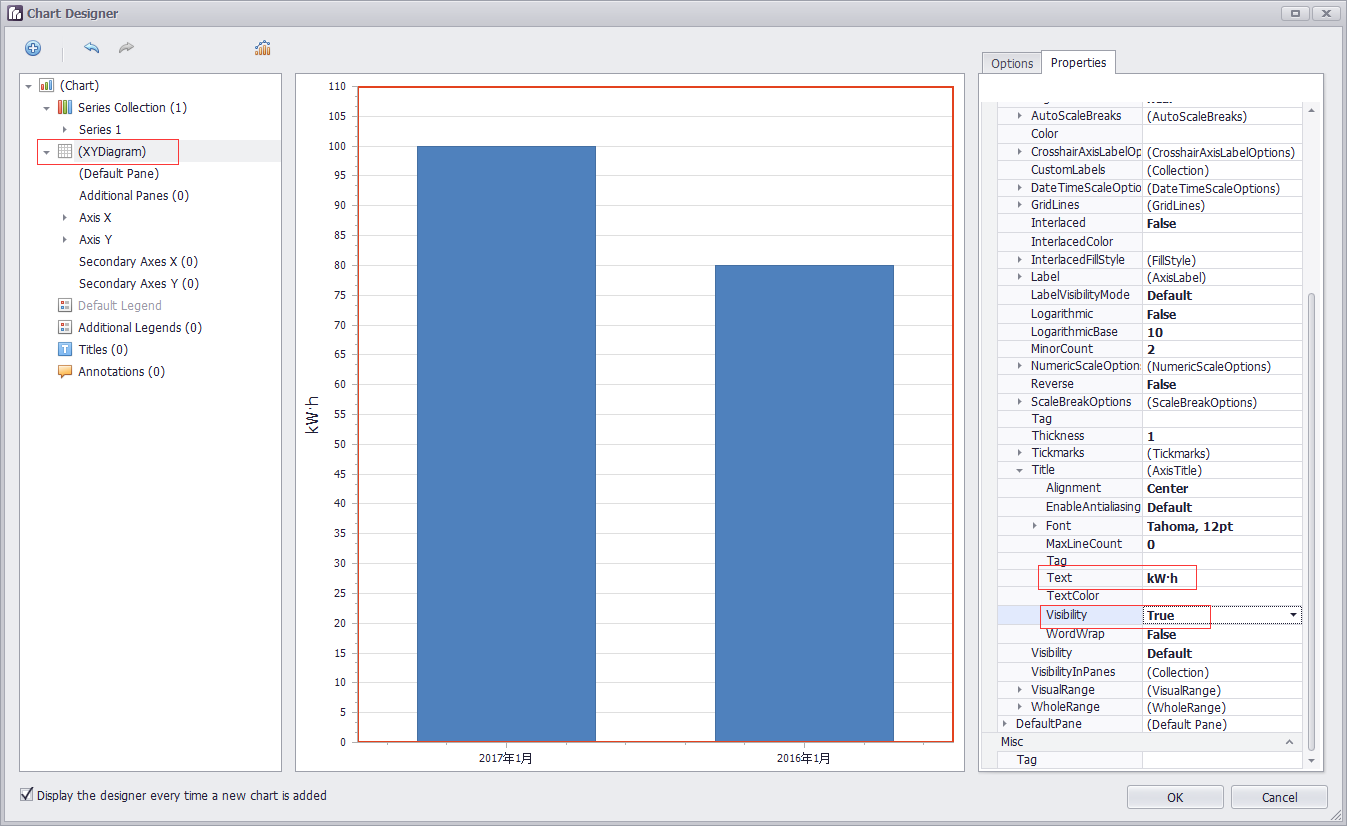
坐标轴标题
DevExpress.XtraCharts.XYDiagram xyDiagram1 = new DevExpress.XtraCharts.XYDiagram();
xyDiagram1.AxisX.Title.Text = "时间";
            xyDiagram1.AxisX.Title.Visibility = DevExpress.Utils.DefaultBoolean.True;
            xyDiagram1.AxisX.VisibleInPanesSerializable = "-1";
            xyDiagram1.AxisY.Title.Text = "用电量(KW·h)";
            xyDiagram1.AxisY.Title.Visibility = DevExpress.Utils.DefaultBoolean.True;
            xyDiagram1.AxisY.VisibleInPanesSerializable = "-1";
            this.chartControl1.Diagram = xyDiagram1;
坐标轴类型
https://documentation.devexpress.com/#WindowsForms/CustomDocument5799
首先设置曲线的ArgumentScaleType 【横轴是argument,纵轴是value】
series1.ArgumentScaleType = DevExpress.XtraCharts.ScaleType.DateTime;
设置好之后,坐标轴那边会自动出现DateTimeScaleOptions的属性
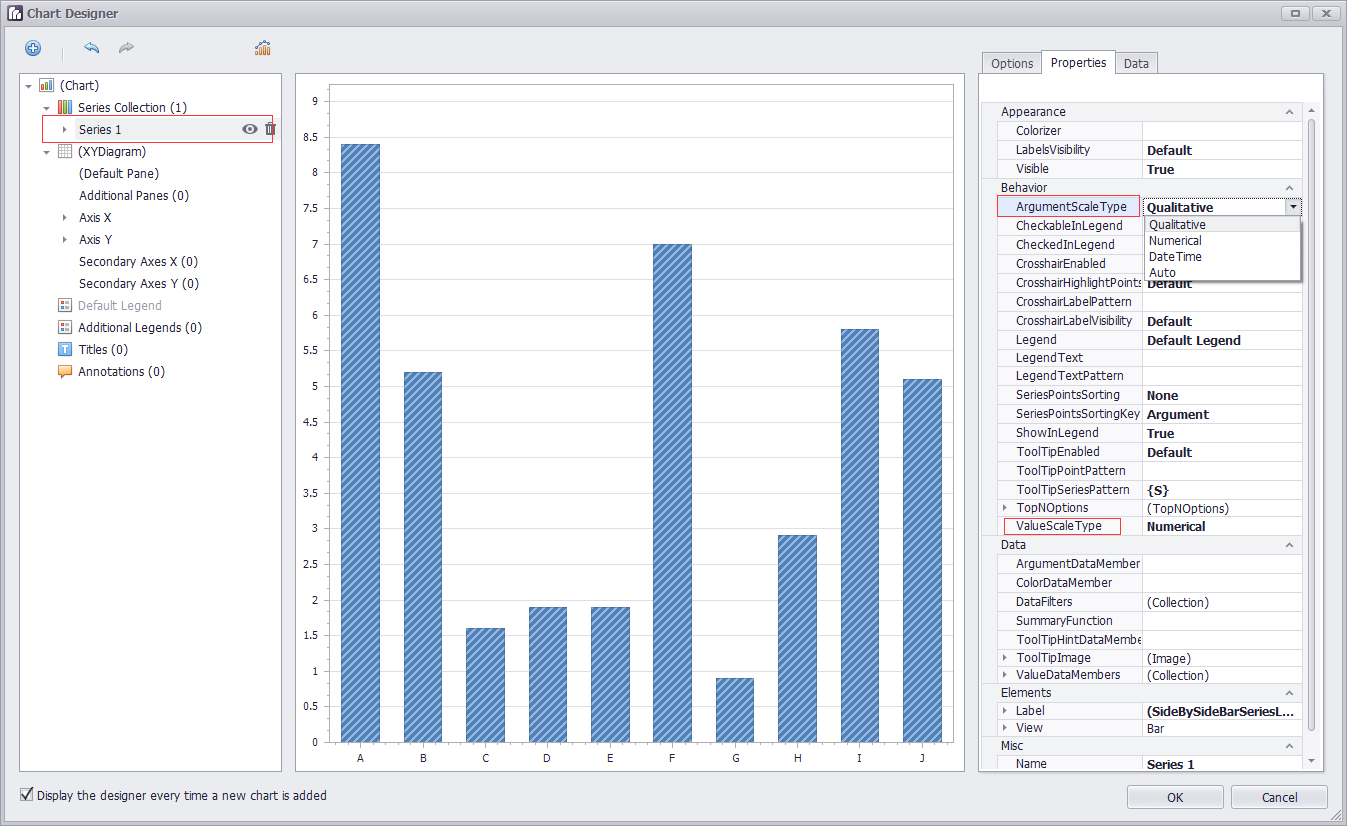
横轴自定义(同比,环比) series1.ArgumentScaleType = DevExpress.XtraCharts.ScaleType.Qualitative;
坐标轴范围
https://documentation.devexpress.com/#WindowsForms/CustomDocument5803
Visual Ranges and Whole Ranges
坐标轴的滑动
            xyDiagram1.EnableAxisXScrolling = true;
            xyDiagram1.EnableAxisYScrolling = true;
            xyDiagram1.AxisY.VisualRange.Auto = false;
            xyDiagram1.AxisY.VisualRange.MaxValueSerializable = "10";
            xyDiagram1.AxisY.VisualRange.MinValueSerializable = "0";
            xyDiagram1.AxisY.WholeRange.Auto = false;
            xyDiagram1.AxisY.WholeRange.MaxValueSerializable = "100";
            xyDiagram1.AxisY.WholeRange.MinValueSerializable = "0";
Visual Range的范围小于WholeRange的范围确保了有滑动的可能
获取坐标轴
XYDiagram diagram = chart.Diagram as XYDiagram;
if (diagram != null) {
    diagram.AxisY.Title.Text = "Population mid-year, millions";
}
图表的标题
Titles处add一个
            DevExpress.XtraCharts.ChartTitle chartTitle1 = new DevExpress.XtraCharts.ChartTitle();

            chartTitle1.Text = "图表标题";
            this.chartControl1.Titles.AddRange(new DevExpress.XtraCharts.ChartTitle[] {
            chartTitle1});
柱状图
设置柱子
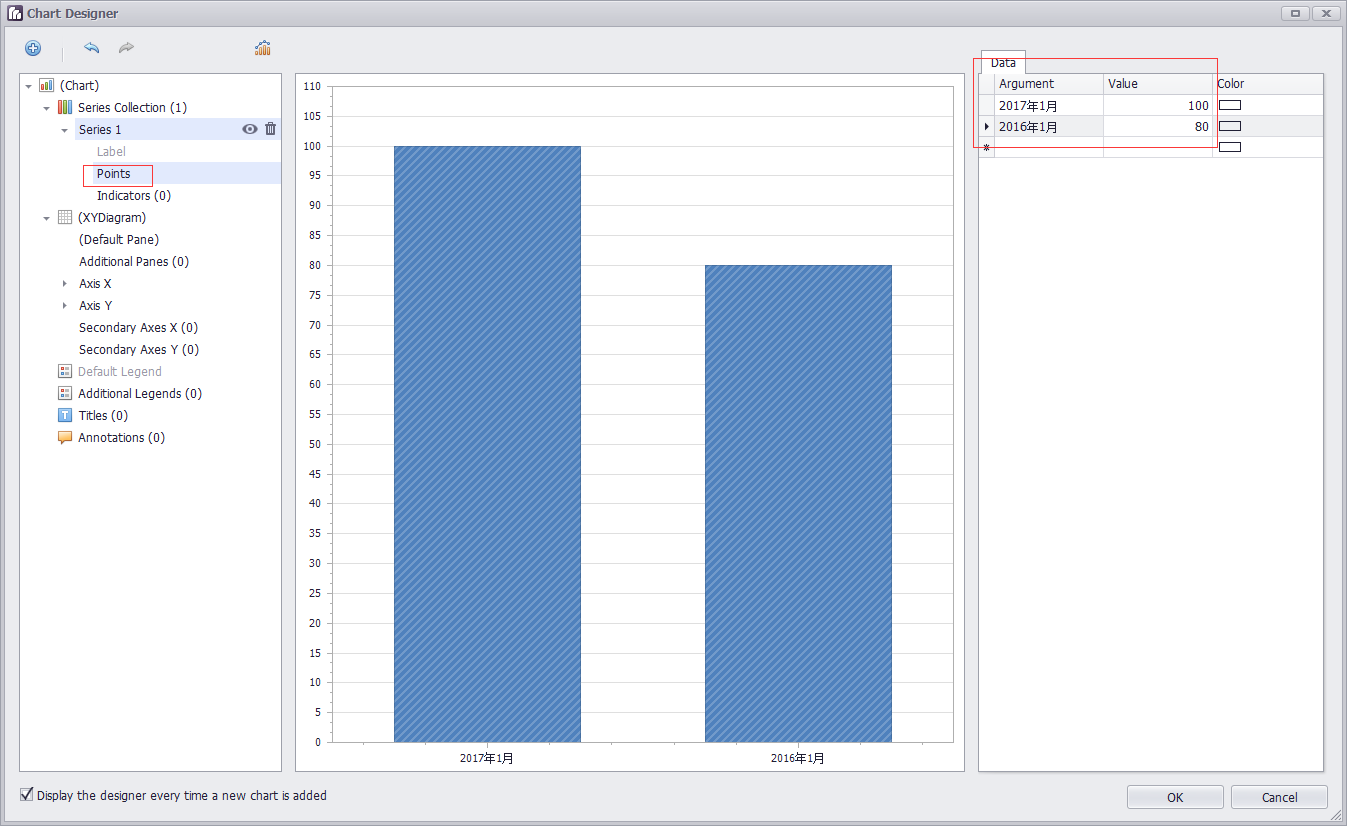
选中Series,展开,选中Points,设置Data中的Argument和Value
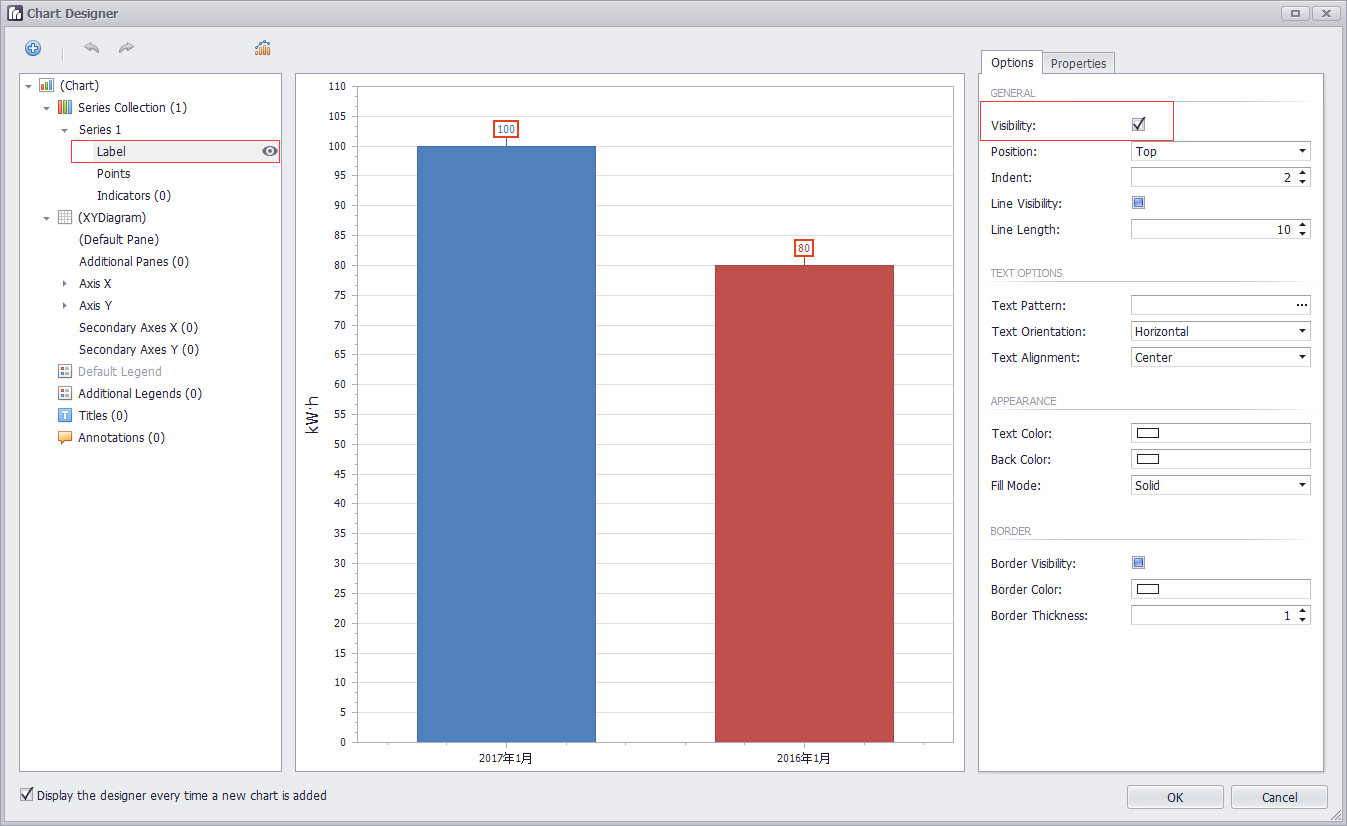
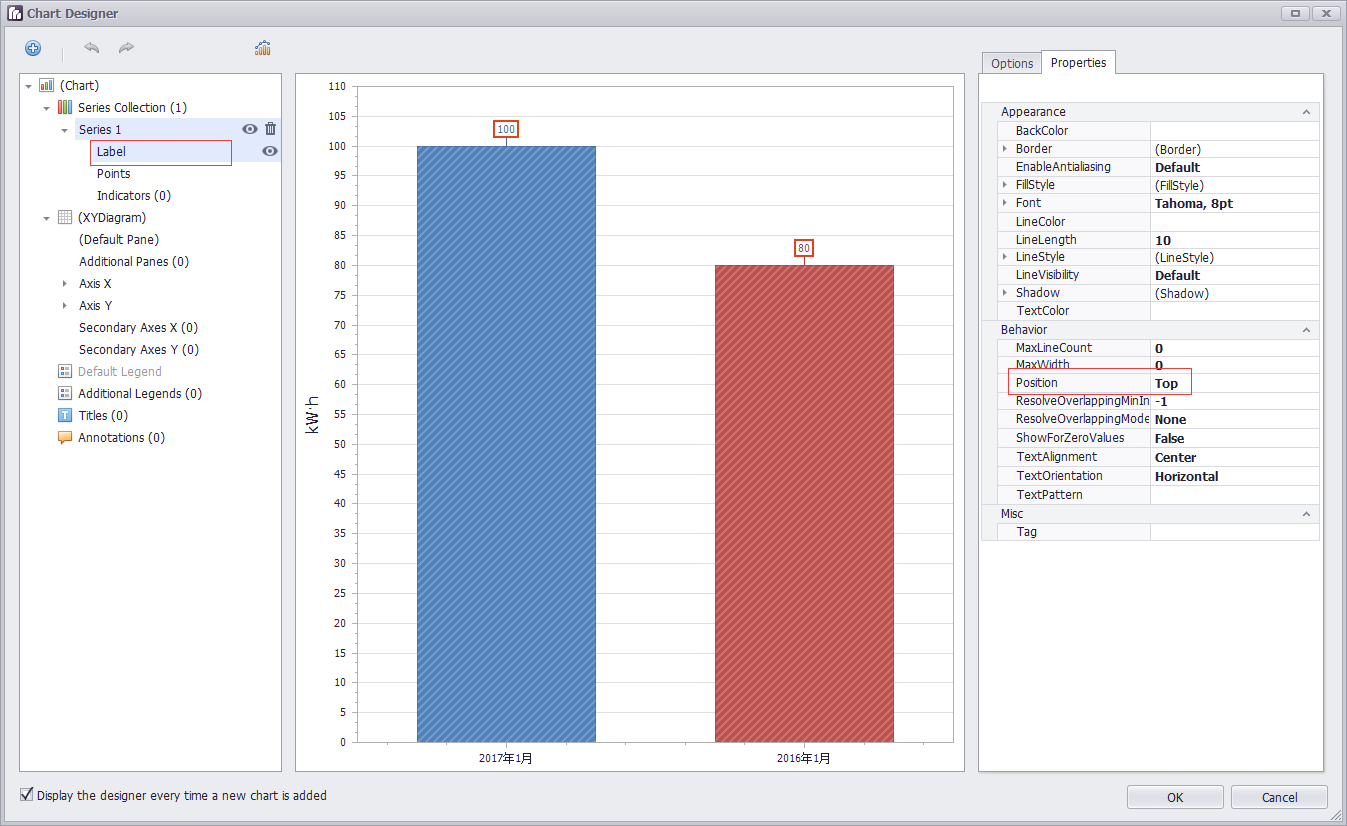
设置数值显示的位置
case "Top":
label.Position = BarSeriesLabelPosition.Top;
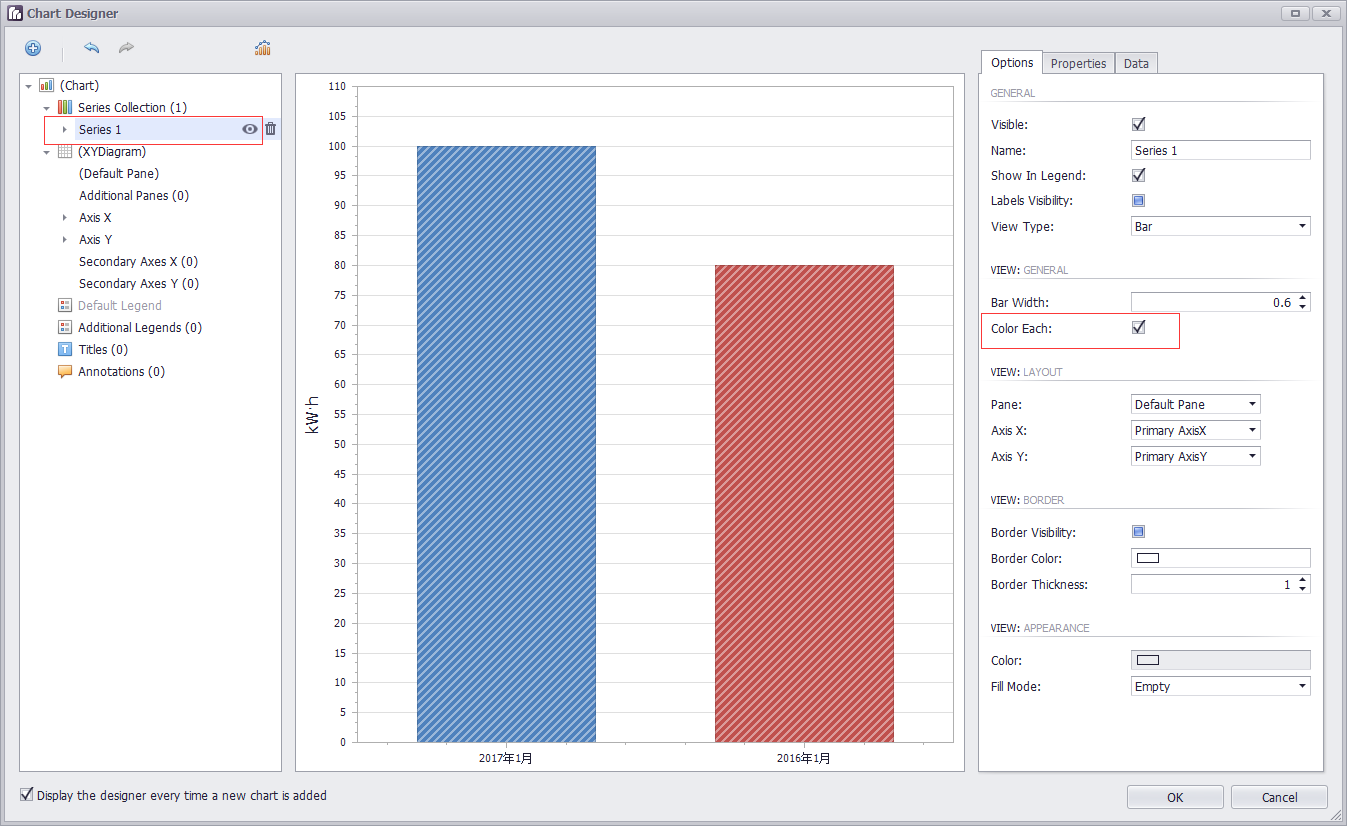
设置柱子的颜色
每一个柱子的颜色不同: 只需要在run designer界面,设置ColorEach就会自动生成如下代码
DevExpress.XtraCharts.SideBySideBarSeriesView sideBySideBarSeriesView1 = new DevExpress.XtraCharts.SideBySideBarSeriesView();
sideBySideBarSeriesView1.ColorEach = true;
series1.View = sideBySideBarSeriesView1;
动态设置柱状图横轴上的点
chartControl1.Series[0].Points[0].Argument = dateTime.ToString($"yyyy年第{week}周");
chartControl1.Series[0].Points[1].Argument = dateTime.AddDays(-7).ToString($"yyyy年第{week1}周");
==========================================
关于刻度
https://documentation.devexpress.com/#WindowsForms/CustomDocument18209
Tickmarks are dashes of different sizes and shapes that mark scale values with the specific step.
There are two types of tickmarks - major tickmarks that are able to display related scale values and minor tickmarks,
which are dashes of a smaller size without text, located between two neighboring major tickmarks (see the figure below).
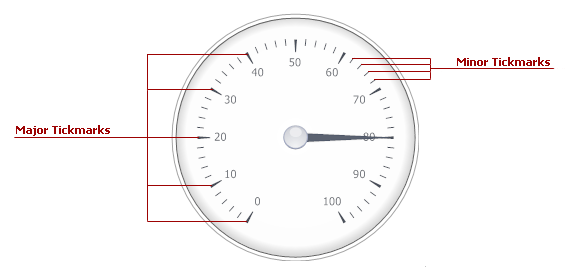
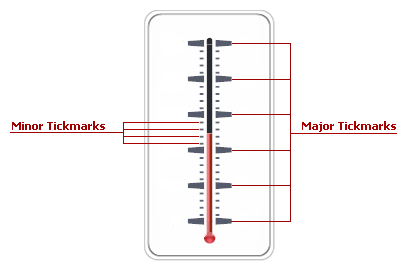
To specify the number of tickmarks, use the ArcScale.MajorTickCount and ArcScale.MinorTickCount properties (the LinearScale.MajorTickCount and LinearScale.MinorTickCount properties for linear scales).
MajorTickCount 控制从头到尾的大刻度的数量,假如范围从-20到40。要六等分,那么大刻度的数量是60/6+1=7
MinorTickCount 控制两个大刻度之间小刻度的数量,,假如小刻度的单位是1的话。那么小刻度的数量是10/1-1=9
Just like many other gauge elements, tickmarks can be painted using a specific brush object, assigned to the related properties within the ArcScaleComponent.AppearanceMajorTickmark(LinearScaleComponent.AppearanceMajorTickmark) and ArcScaleComponent.AppearanceMinorTickmark (LinearScaleComponent.AppearanceMinorTickmark) property sections.
Scales have two sets of properties that manage tickmarks of each type - the ArcScale.MajorTickmark and ArcScale.MinorTickmark properties
(the LinearScale.MajorTickmark and LinearScale.MinorTickmark properties for linear scales). These sections provide access to such properties as:
- IMajorTickmark.ShowTick (IMinorTickmark.ShowTick) - gets or sets if the tickmark dash should be displayed;
- IMajorTickmark.ShapeType (IMinorTickmark.ShapeType) - specifies the shape of the tickmark dash if dashes are displayed;
- IMajorTickmark.ShowText - allows you to display scale values for major tickmarks;
- IMajorTickmark.ShowFirst and IMajorTickmark.ShowLast - gets or sets if tickmarks for minimum and/or maximum values are enabled.
相关文章
- EasyMvc入门教程-图形控件说明(21)线形图+柱状图+饼形图
- Google Earth Engine(GEE)——DataTable图(NDVI计算实例)区域图、折线图和柱状图
- Google Earth Engine(GEE)——矢量柱状图和组图
- Google Earth Engine(GEE)——特征和特征集合图表概述和柱状图
- Matplotlib常见图形绘制(折线图、散点图、柱状图、直方图、饼图)
- 234Echarts - 3D 柱状图(Bar3D - Simplex Noise)
- 55Echarts - 柱状图(Series Layout By Column or Row)
- 48Echarts - 柱状图(Dynamic Data)
- 31Echarts - 柱状图(特性示例:渐变色 阴影 点击缩放)
- 小小数据统计(柱状图、折线图、扇形图)
- Qt编写的项目作品17-自定义曲线图柱状图
- Android 一步步实现曲线图、折线图、柱状图、雷达图,动态心跳图
- vue怎么引入echats并使用 (柱状图 字符云)
- 用canvas来绘制柱状图,简单明了,绝对实用!