
DCGM-Exporter 安装 显卡监控 Prometheus
2023-09-14 09:16:04 时间
DCGM-Exporter 安装 显卡监控
1.使用docker方式
- 安装显卡驱动
nvidia-smi可以查看 - 安装Nvidia Docker
docker run -d --gpus all --rm -p 9400:9400 nvidia/dcgm-exporter:2.0.13-2.1.1-ubuntu18.04
# docker run -d --gpus all --rm -p 9400:9400 nvidia/dcgm-exporter:2.0.13-2.1.1-ubuntu18.04
Unable to find image 'nvidia/dcgm-exporter:2.0.13-2.1.1-ubuntu18.04' locally
2.0.13-2.1.1-ubuntu18.04: Pulling from nvidia/dcgm-exporter
171857c49d0f: Pull complete
419640447d26: Pull complete
61e52f862619: Pull complete
2a93278deddf: Pull complete
c9f080049843: Pull complete
8189556b2329: Pull complete
293c994cc6c2: Pull complete
f79d1a4211c3: Pull complete
fe75137a11ed: Pull complete
35772a4b9159: Pull complete
fdd8c9ae911c: Pull complete
Digest: sha256:31ac69add9788b12f7635d1af23a51b8d740d897a7d4050568190ad8ff6a9a5d
Status: Downloaded newer image for nvidia/dcgm-exporter:2.0.13-2.1.1-ubuntu18.04
198fdc1b5cff4661a6ff7cef80b6b033ff1380340614dc886e5a60c7bd7754f5
# docker ps
CONTAINER ID   IMAGE                                           COMMAND                  CREATED              STATUS              PORTS                    NAMES
198fdc1b5cff   nvidia/dcgm-exporter:2.0.13-2.1.1-ubuntu18.04   "/usr/local/dcgm/dcg…"   About a minute ago   Up About a minute   0.0.0.0:9400->9400/tcp   objective_morse
2.查看显卡参数
curl localhost:9400/metrics
# curl localhost:9400/metrics
# HELP DCGM_FI_DEV_SM_CLOCK SM clock frequency (in MHz).
# TYPE DCGM_FI_DEV_SM_CLOCK gauge
# HELP DCGM_FI_DEV_MEM_CLOCK Memory clock frequency (in MHz).
# TYPE DCGM_FI_DEV_MEM_CLOCK gauge
# HELP DCGM_FI_DEV_MEMORY_TEMP Memory temperature (in C).
# TYPE DCGM_FI_DEV_MEMORY_TEMP gauge
# HELP DCGM_FI_DEV_GPU_TEMP GPU temperature (in C).
# TYPE DCGM_FI_DEV_GPU_TEMP gauge
# HELP DCGM_FI_DEV_POWER_USAGE Power draw (in W).
3.Prometheus配置文件修改
vim prometheus.yml
- 添加
dcgm-exporter
scrape_configs:
# The job name is added as a label `job=<job_name>` to any timeseries scraped from this config.
- job_name: 'prometheus'
# metrics_path defaults to '/metrics'
# scheme defaults to 'http'.
static_configs:
- targets: ['localhost:9090']
# node_exporter
- job_name: 'node'
static_configs:
- targets: ['127.0.0.1:9100','192.168.10.3:9100']
# dcgm-exporter
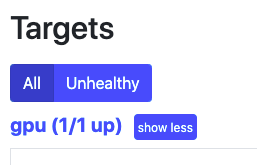
- job_name: 'gpu'
static_configs:
- targets: ['192.168.10.3:9400']
systemctl restart prometheus.service
IP:9090
4.grafana仪表板导入
- 使用
12639

参考:
相关文章
- 从0开始,3步构建Nginx日志监控和运营指标
- Windows文件服务器文件审计,文件监控软件,File_System_Auditor2.53安装教程[通俗易懂]
- 1.Prometheus监控入门之介绍整体架构及安装
- 原创|MySQL performance_schema之内存监控
- 如何在 Ubuntu 22.04 上安装和配置 Graphite 监控系统?
- 史上最详细的Zabbix监控系统安装部署过程(图文)
- 在centos上安装Munin监控服务器运行状态
- kubernetes安装prometheus监控集群状态
- Zabbix监控基础架构
- 使用Prometheus联动Grafana监控kubernetes集群状态
- Linux基础:性能监控工具nmon安装及使用教程
- JProfiler远程监控Linux上Tomcat的安装过程细讲(步骤非常详细!!!)详解编程语言
- Linux IO性能监控实践(监控linuxio)
- Linux系统运行状态监控实操经验(linux系统监控)
- Zabbix安装(十):监控windows进程
- Linux上网络监控工具ntopng 的安装
- Linux文件变化监控:实时审视文件的状态(linux文件变化监控)
- Linux上网络监控工具ntopng 的安装
- MSSQL中监控表变化的动态方法(mssql 监视表变化)
- 监控redis,抓取有价值的数据(监听获取redis的值)
- 天兔监控Redis实现零延迟秒级运行(天兔监控redis)