
Python学习笔记八之matplotlib绘制三维图
2023-09-14 09:14:40 时间
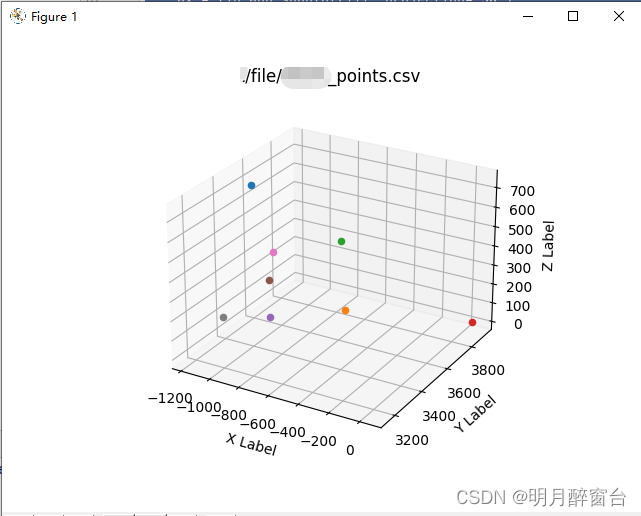
1.绘制散点图(读取csv)
import csv  # 导入csv模块
import matplotlib.pyplot as plt

#绘制石头三位点
file1 = './file/stone_points.csv'
with open(file1) as f:
    reader = csv.reader(f)
    header_row = next(reader)  # 返回文件的下一行,在这便是首行,即文件头

    fig = plt.figure(1)
    #fig = plt.subplot(1, 2, 1)
    ax = fig.add_subplot(111, projection='3d')

    data1=[]
    for ret in reader:
        x=float(ret[0])
        y=float(ret[1])
        z=float(ret[2])
        data1.append([x,y,z])
        print(x," ",y," ",z)

        ax.scatter(x,y,z,('r', 'o', -50, -25))

    ax.set_xlabel('X Label')
    ax.set_ylabel('Y Label')
    ax.set_zlabel('Z Label')
    plt.title(file1)
    plt.show()
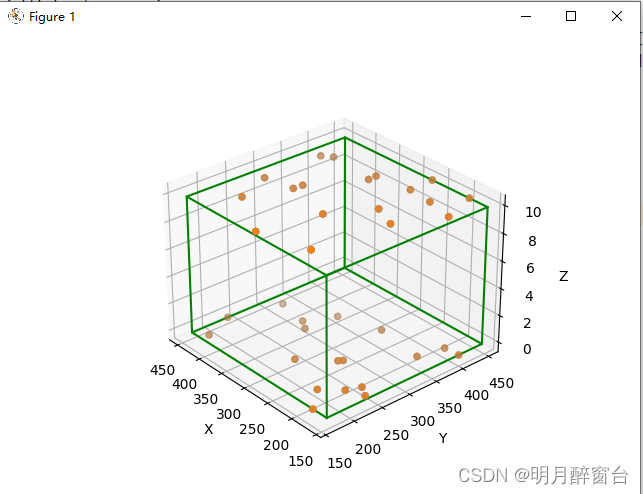
2.绘制散点图+立体框
import matplotlib.pyplot as plt

file1=".\\file\\stone_points.txt"
file2=".\\file\\rois.txt"

#绘制石头+立体框

#石头坐标
stone_p=open(file1,"r",encoding='utf-8').readlines()
print(stone_p)
x,y,z=[],[],[]
for str in stone_p:
    point=str.split("\t")
    #print(point)
    x.append(int(point[0]))
    y.append(int(point[1]))
    z.append(int(point[2]))

#读取立体框
bevel=open(file2,"r",encoding='utf-8').readline()
ret=bevel.split("\t")
x_min,y_min,z_min,l,w,h=int(ret[0]),int(ret[1]),int(ret[2]),int(ret[3]),int(ret[4]),int(ret[5])
p0=[x_min,y_min,z_min]
p1=[x_min+l,y_min,z_min]
p2=[x_min+l,y_min+w,z_min]
p3=[x_min,y_min+w,z_min]
p4=[x_min,y_min,z_min+h]
p5=[x_min+l,y_min,z_min+h]
p6=[x_min+l,y_min+w,z_min+h]
p7=[x_min,y_min+w,z_min+h]


#画图
ax1=plt.axes(projection="3d")
ax1.scatter(x,y,z,cmap="Blues")
ax1.scatter(x,y,z)
ax1.plot3D([p0[0],p1[0],p2[0],p3[0],p0[0]],[p0[1],p1[1],p2[1],p3[1],p0[1]],[p0[2],p1[2],p2[2],p3[2],p0[2]],color="green")
ax1.plot([p4[0],p5[0],p6[0],p7[0],p4[0]],[p4[1],p5[1],p6[1],p7[1],p0[1]],[p4[2],p5[2],p6[2],p7[2],p4[2]],color="green")
ax1.plot([p0[0],p4[0]],[p0[1],p4[1]],[p0[2],p4[2]],color="green")
ax1.plot([p1[0],p5[0]],[p1[1],p5[1]],[p1[2],p5[2]],color="green")
ax1.plot([p2[0],p6[0]],[p2[1],p6[1]],[p2[2],p6[2]],color="green")
ax1.plot([p3[0],p7[0]],[p3[1],p7[1]],[p3[2],p7[2]],color="green")

ax1.set_xlabel("X")
ax1.set_ylabel("Y")
ax1.set_zlabel("Z")
ax1.invert_yaxis()
plt.show()
相关文章
- 【Python成长之路】python 基础篇 -- global/nonlocal关键字使用
- python使用matplotlib绘制折线图教程
- Python命名规范
- python 检测字符串编码类型是什么
- Python学习笔记 使用matplotlib创建Gif动图
- Python语言学习:利用python获取当前/上级/上上级目录路径(获取路径下的最后叶目录的文件名、合并两个不同路径下图片文件名等目录/路径案例、正确加载图片路径)之详细攻略
- Python:利用python语言实现18位身份证号码和15位身份证号码相互转换
- Python编程语言学习:python的列表的特殊应用之一行命令实现if判断中的两类判断
- 100天精通Python(可视化篇)——第79天:matplotlib绘制不同种类炫酷折线图代码实战(网格、趋势、对比、百分比、多条折线、堆积、百分比堆积、多坐标子图、3D折线图)
- 已解决2.Set PROTOCOL_BUFFERS_PYTHON_IMPLEMENTATION=python (but this will use pure-Python parsing and wi
- 已解决 Failed to build opencv-python-headless
- 已解决Visit python.org to download an earlier version of Python.
- Python爬虫基础:scrapy 框架—ltem和scrapy.Request
- python类与类方法的实现
- 【Python成长之路】python并发学习:多进程与多线程的用法及场景介绍
- python 的requests如何使用代理
- Python编程:twine模块打包python项目上传pypi
- python 将一个JSON 字典转换为一个Python 对象
- python与其它语言进行比較
- 小学生蓝桥杯Python闯关 | 绘制四叶风轮
- python基础===Python 迭代器模块 itertools 简介
- 【2023年第十一届泰迪杯数据挖掘挑战赛】A题:新冠疫情防控数据的分析 建模方案及python代码详解
- 【python 12】Matplotlib 教程
- Python: 爬虫入门-python爬虫入门教程(非常详细)
- 〖Python自动化办公篇⑲〗 - python实现邮件自动化 - 邮件发送