
【博客543】golang pprof性能调试:寻找cpu瓶颈
2023-09-14 09:12:53 时间
golang pprof性能调试:寻找cpu瓶颈
1、引入pprof进行性能调试
在代码中加入:
import _ "net/http/pprof"

go func() {
	  http.ListenAndServe("0.0.0.0:8899", nil)
}()
示例:为冒泡排序加入pprof debug
package main

import (
	"math/rand"
	"net/http"
	_ "net/http/pprof"
	"time"
)

func generate(n int) []int {
	rand.Seed(time.Now().UnixNano())
	nums := make([]int, 0)
	for i := 0; i < n; i++ {
		nums = append(nums, rand.Int())
	}
	return nums
}
func bubbleSort(nums []int) {
	for i := 0; i < len(nums); i++ {
		for j := 1; j < len(nums)-i; j++ {
			if nums[j] < nums[j-1] {
				nums[j], nums[j-1] = nums[j-1], nums[j]
			}
		}
	}
}

func main() {
	go func() {
		http.ListenAndServe("0.0.0.0:8899", nil)
	}()

	for {
		n := 10
		for i := 0; i < 5; i++ {
			nums := generate(n)
			bubbleSort(nums)
			n *= 10
		}
	}
}
2、pprof命令行交互式查看程序最消耗cpu的地方
1、启动上述程序:
go run main.go
2、访问pprof暴露的cpu debug api接口,收集30s内的cpu数据:
go tool pprof http://localhost:8899/debug/pprof/profile\?seconds\=30
3、在交互命令中,使用top,list来查看最消耗cpu的地方
go tool pprof http://localhost:8899/debug/pprof/profile\?seconds\=30
Fetching profile over HTTP from http://localhost:8899/debug/pprof/profile?seconds=30
Saved profile in /Users/zejia.lu/pprof/pprof.samples.cpu.003.pb.gz
Type: cpu
Time: Nov 27, 2022 at 12:09pm (CST)
Duration: 30.19s, Total samples = 26.13s (86.56%)
Entering interactive mode (type "help" for commands, "o" for options)
(pprof) top
Showing nodes accounting for 26.06s, 99.73% of 26.13s total
Dropped 18 nodes (cum <= 0.13s)
      flat  flat%   sum%        cum   cum%
    24.57s 94.03% 94.03%     26.06s 99.73%  main.bubbleSort (inline)
     1.49s  5.70% 99.73%      1.49s  5.70%  runtime.asyncPreempt
         0     0% 99.73%     26.06s 99.73%  main.main
         0     0% 99.73%     26.06s 99.73%  runtime.main
(pprof) list main.bubbleSort
Total: 26.13s
ROUTINE ======================== main.bubbleSort in /Users/zejia.lu/go_pprof/main.go
    24.57s     26.06s (flat, cum) 99.73% of Total
         .          .     15:	}
         .          .     16:	return nums
         .          .     17:}
         .          .     18:func bubbleSort(nums []int) {
         .          .     19:	for i := 0; i < len(nums); i++ {
    12.41s     13.31s     20:		for j := 1; j < len(nums)-i; j++ {
     4.33s      4.92s     21:			if nums[j] < nums[j-1] {
     7.83s      7.83s     22:				nums[j], nums[j-1] = nums[j-1], nums[j]
         .          .     23:			}
         .          .     24:		}
         .          .     25:	}
         .          .     26:}
         .          .     27:
4、输出列解析
flat	当前函数占用 cpu 耗时
flat %	当前函数占用 cpu 耗时百分比
sum%	函数占用 cpu 时间累积占比,从小到大一直累积到 100%
cum	    当前函数加上调用当前函数的函数占用 cpu 的总耗时
%cum	当前函数加上调用当前函数的函数占用 cpu 的总耗时占比
5、结果分析
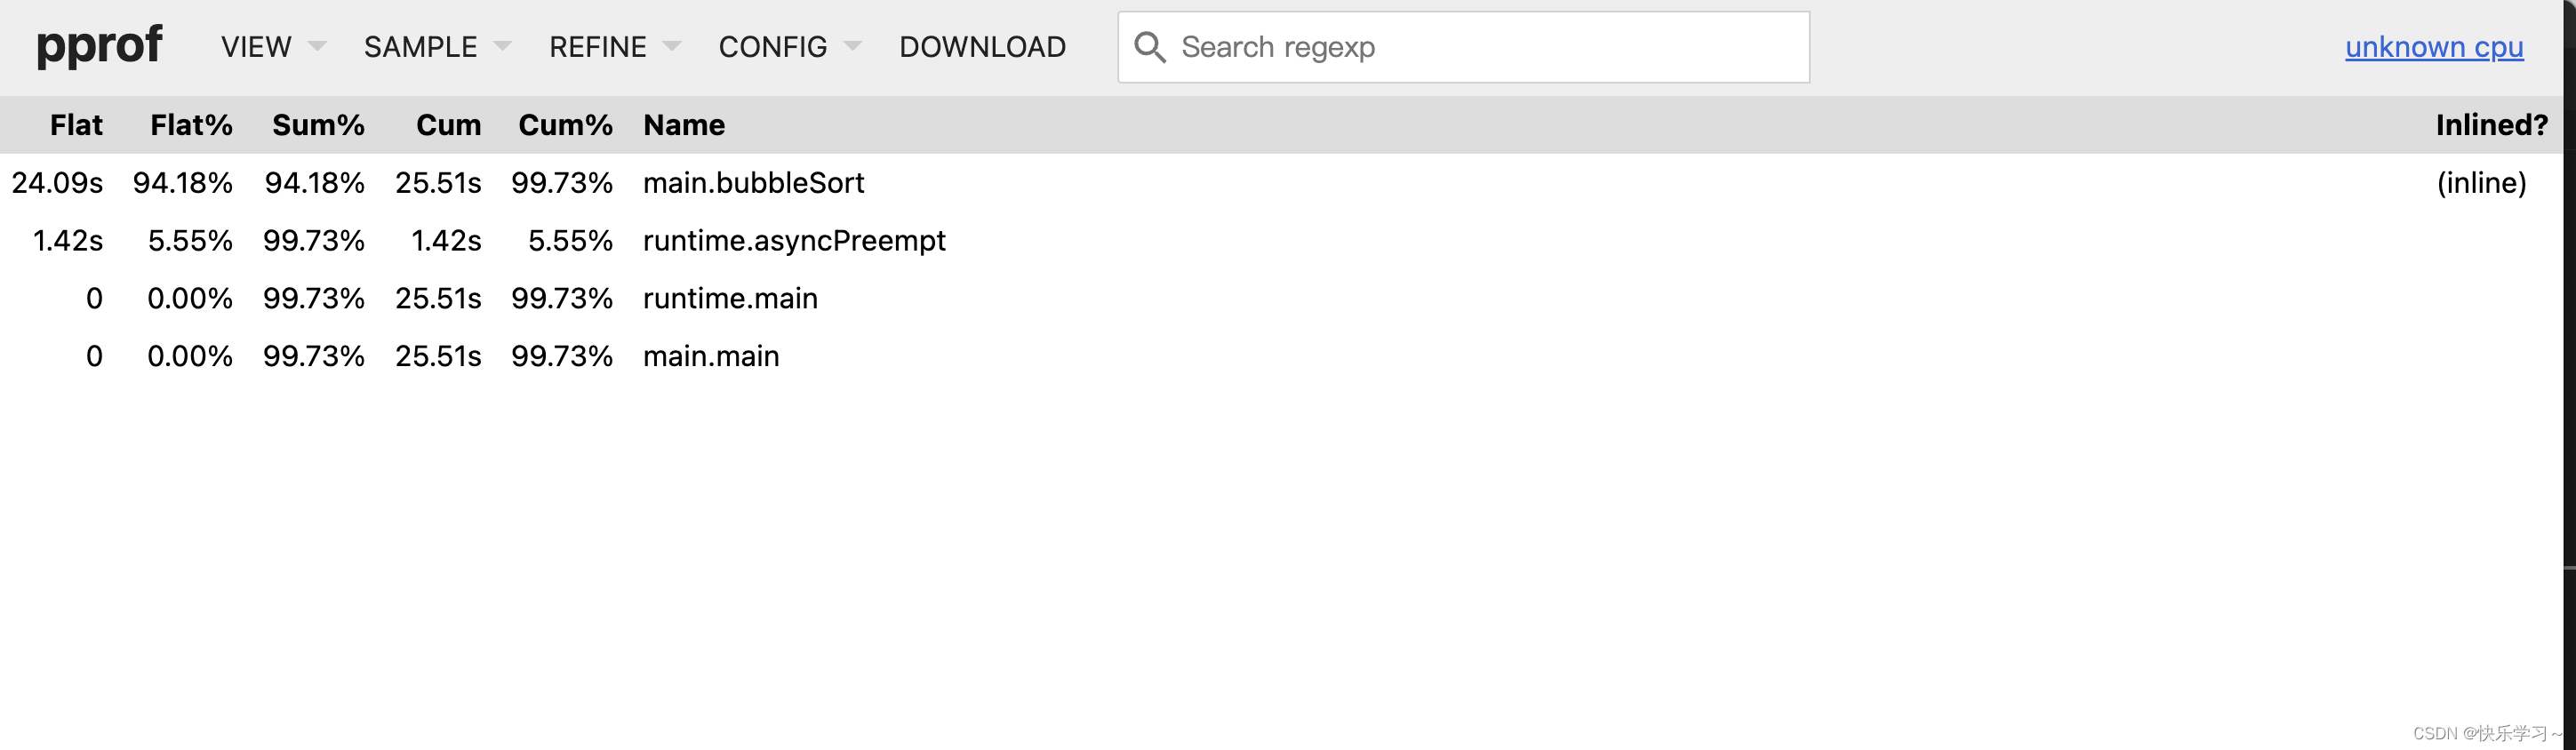
我们可以看到最消耗cpu的函数:
24.57s 94.03% 94.03%     26.06s 99.73%  main.bubbleSort (inline)

我们可以看到这个函数里cpu消耗在哪里:
12.41s     13.31s     20:		for j := 1; j < len(nums)-i; j++ {
4.33s      4.92s     21:			if nums[j] < nums[j-1] {
7.83s      7.83s     22:				nums[j], nums[j-1] = nums[j-1], nums[j]
3、pprof ui方式查看程序最消耗cpu的地方
1、调试时指定通过ui方式查看,ui地址为8888端口,要调试的服务暴露的pprof端口为8899:
go tool pprof -http=":8888" http://localhost:8899/debug/pprof/profile
2、访问8888端口查看ui界面进行可视化调试:
查看最消耗cpu的地方:
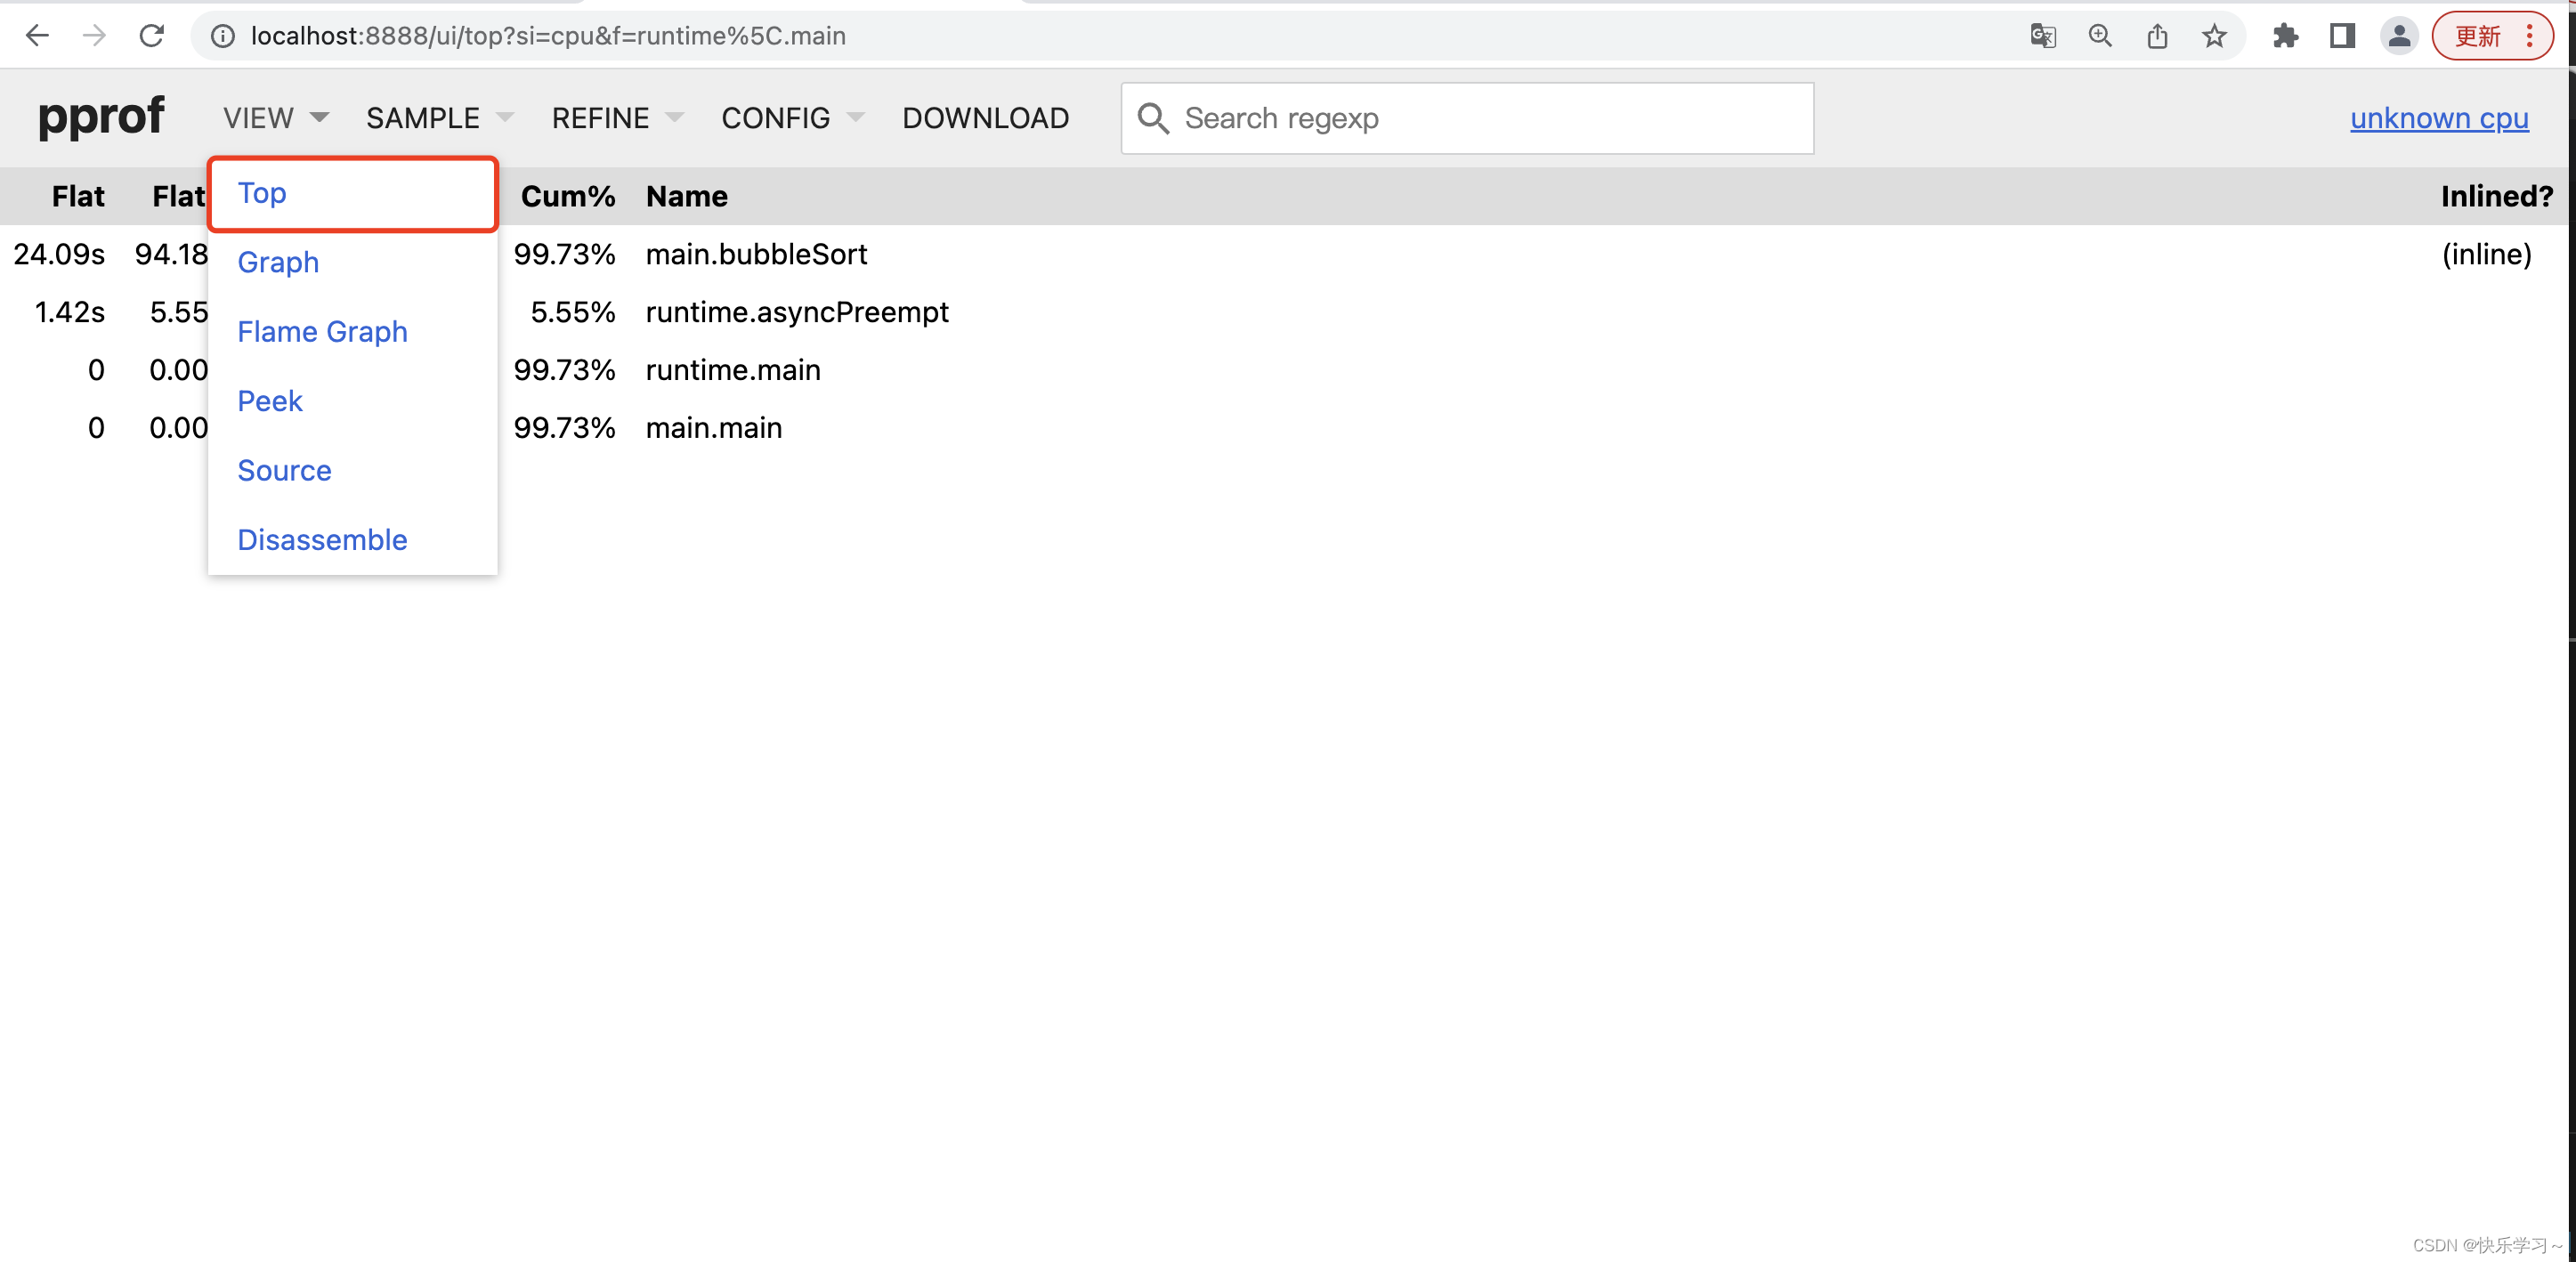
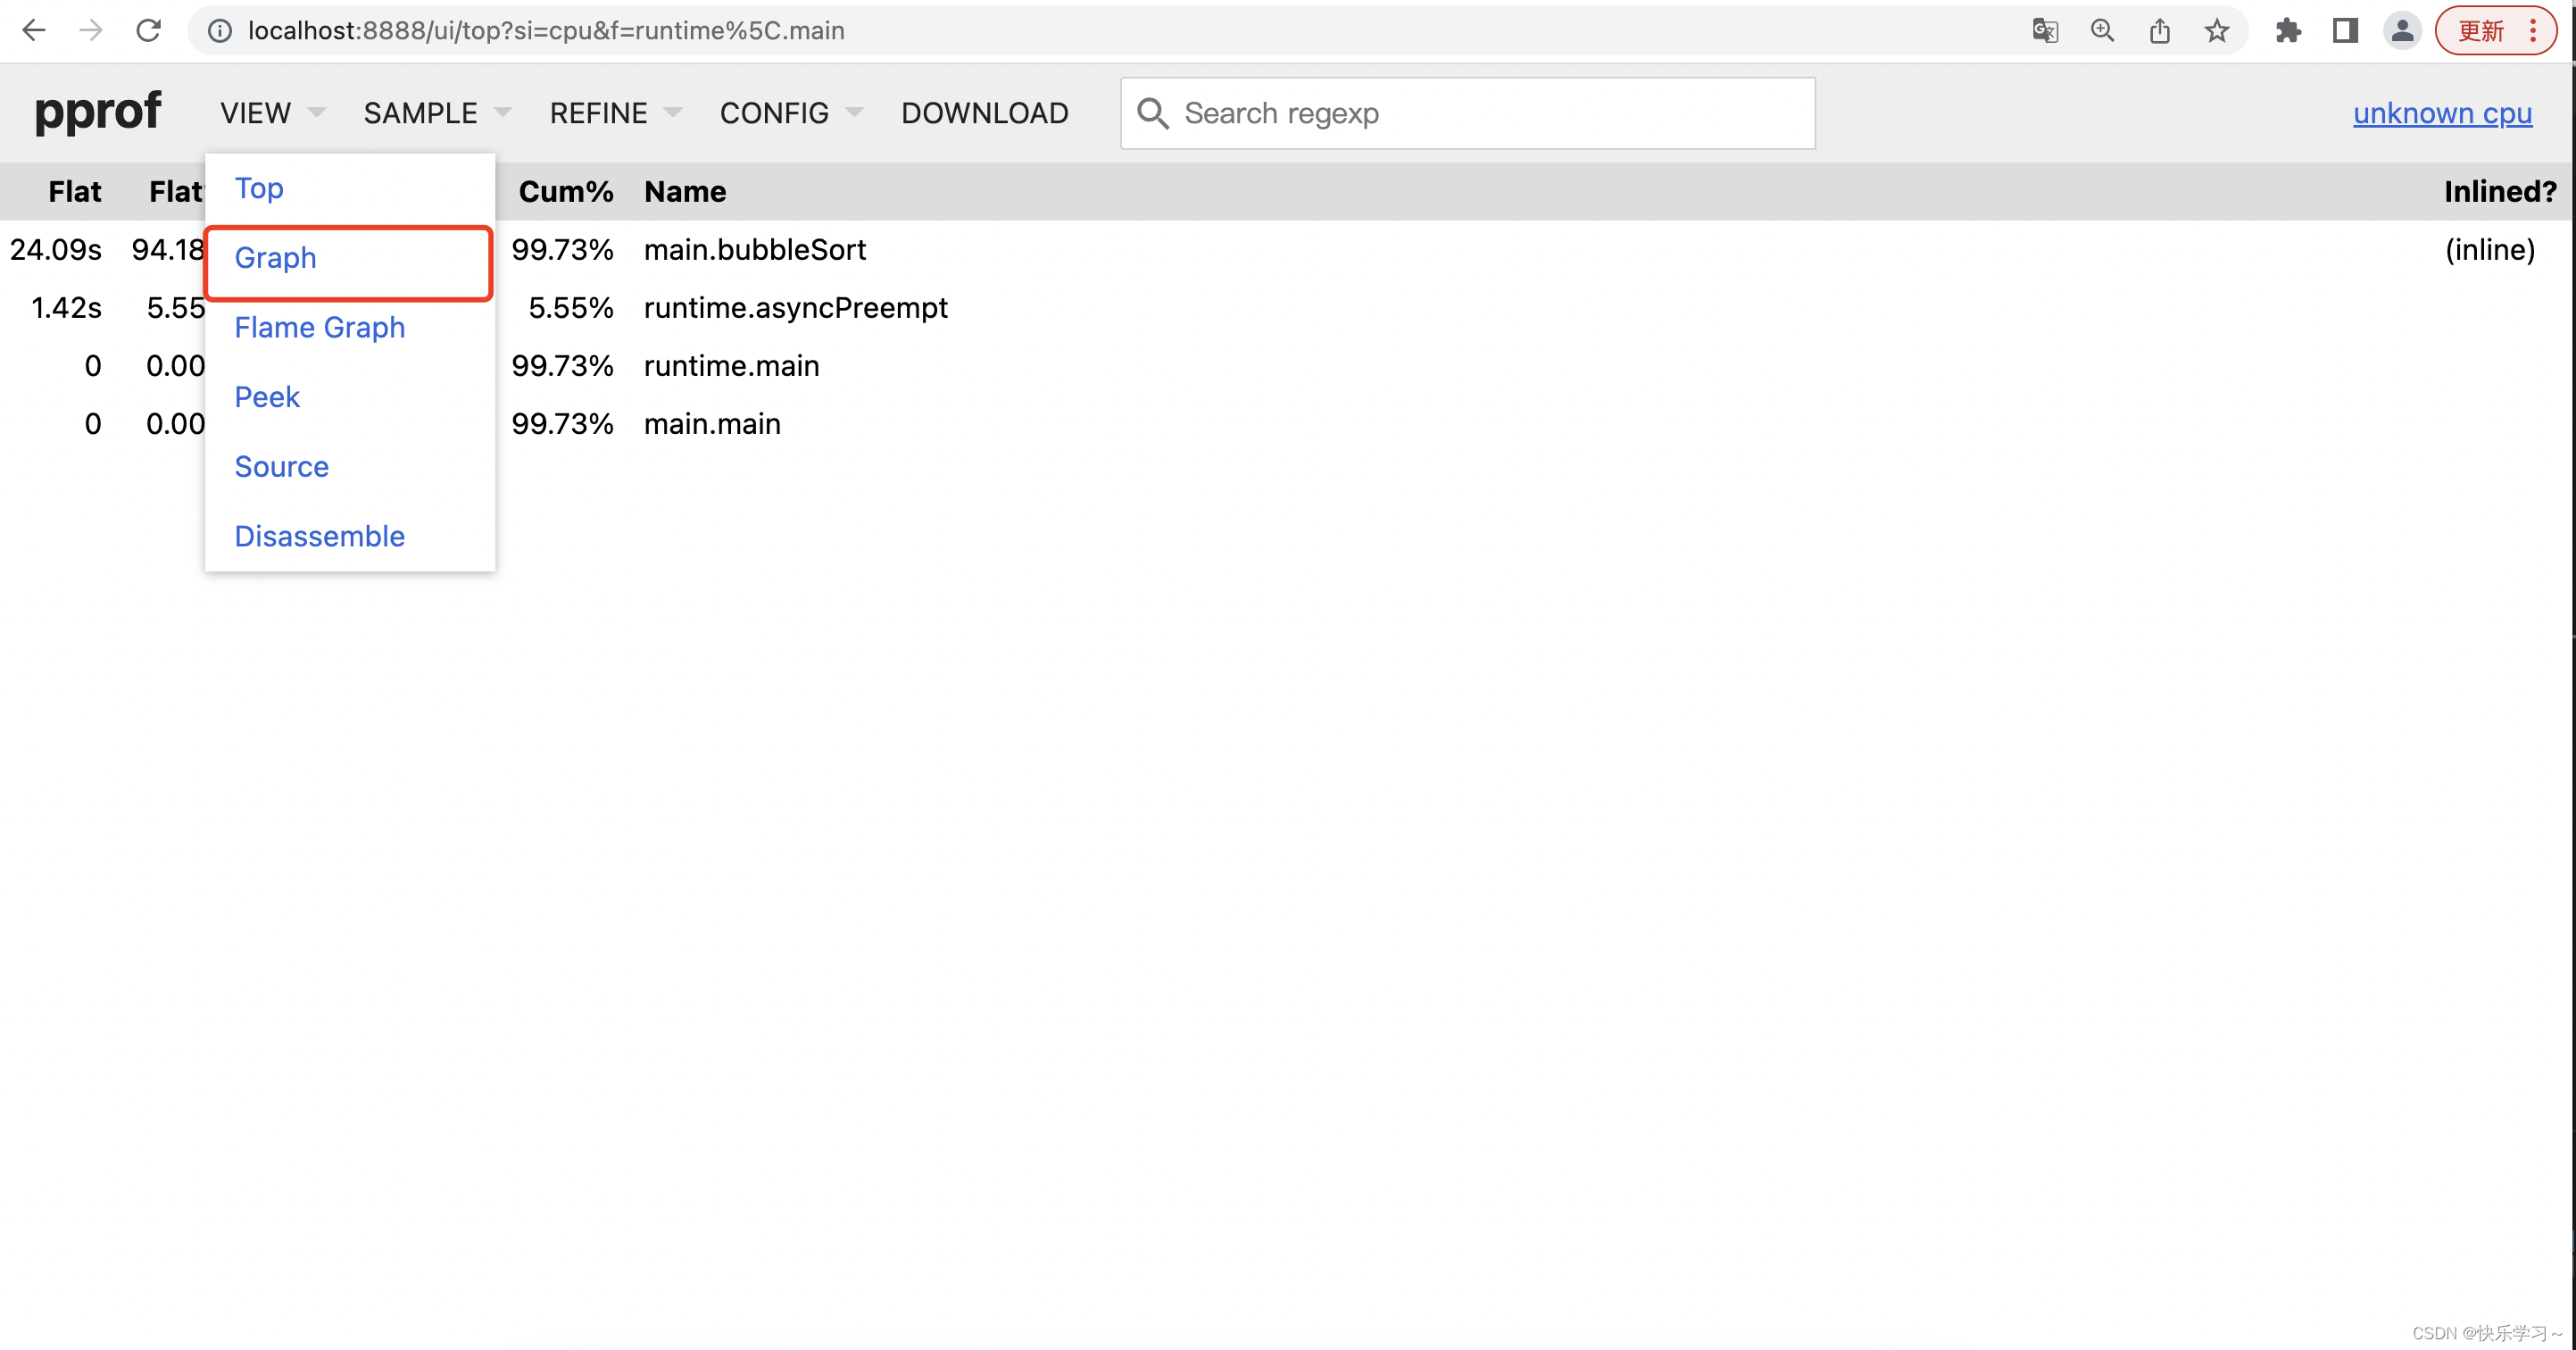
4、pprof ui方式查看cpu消耗拓扑图
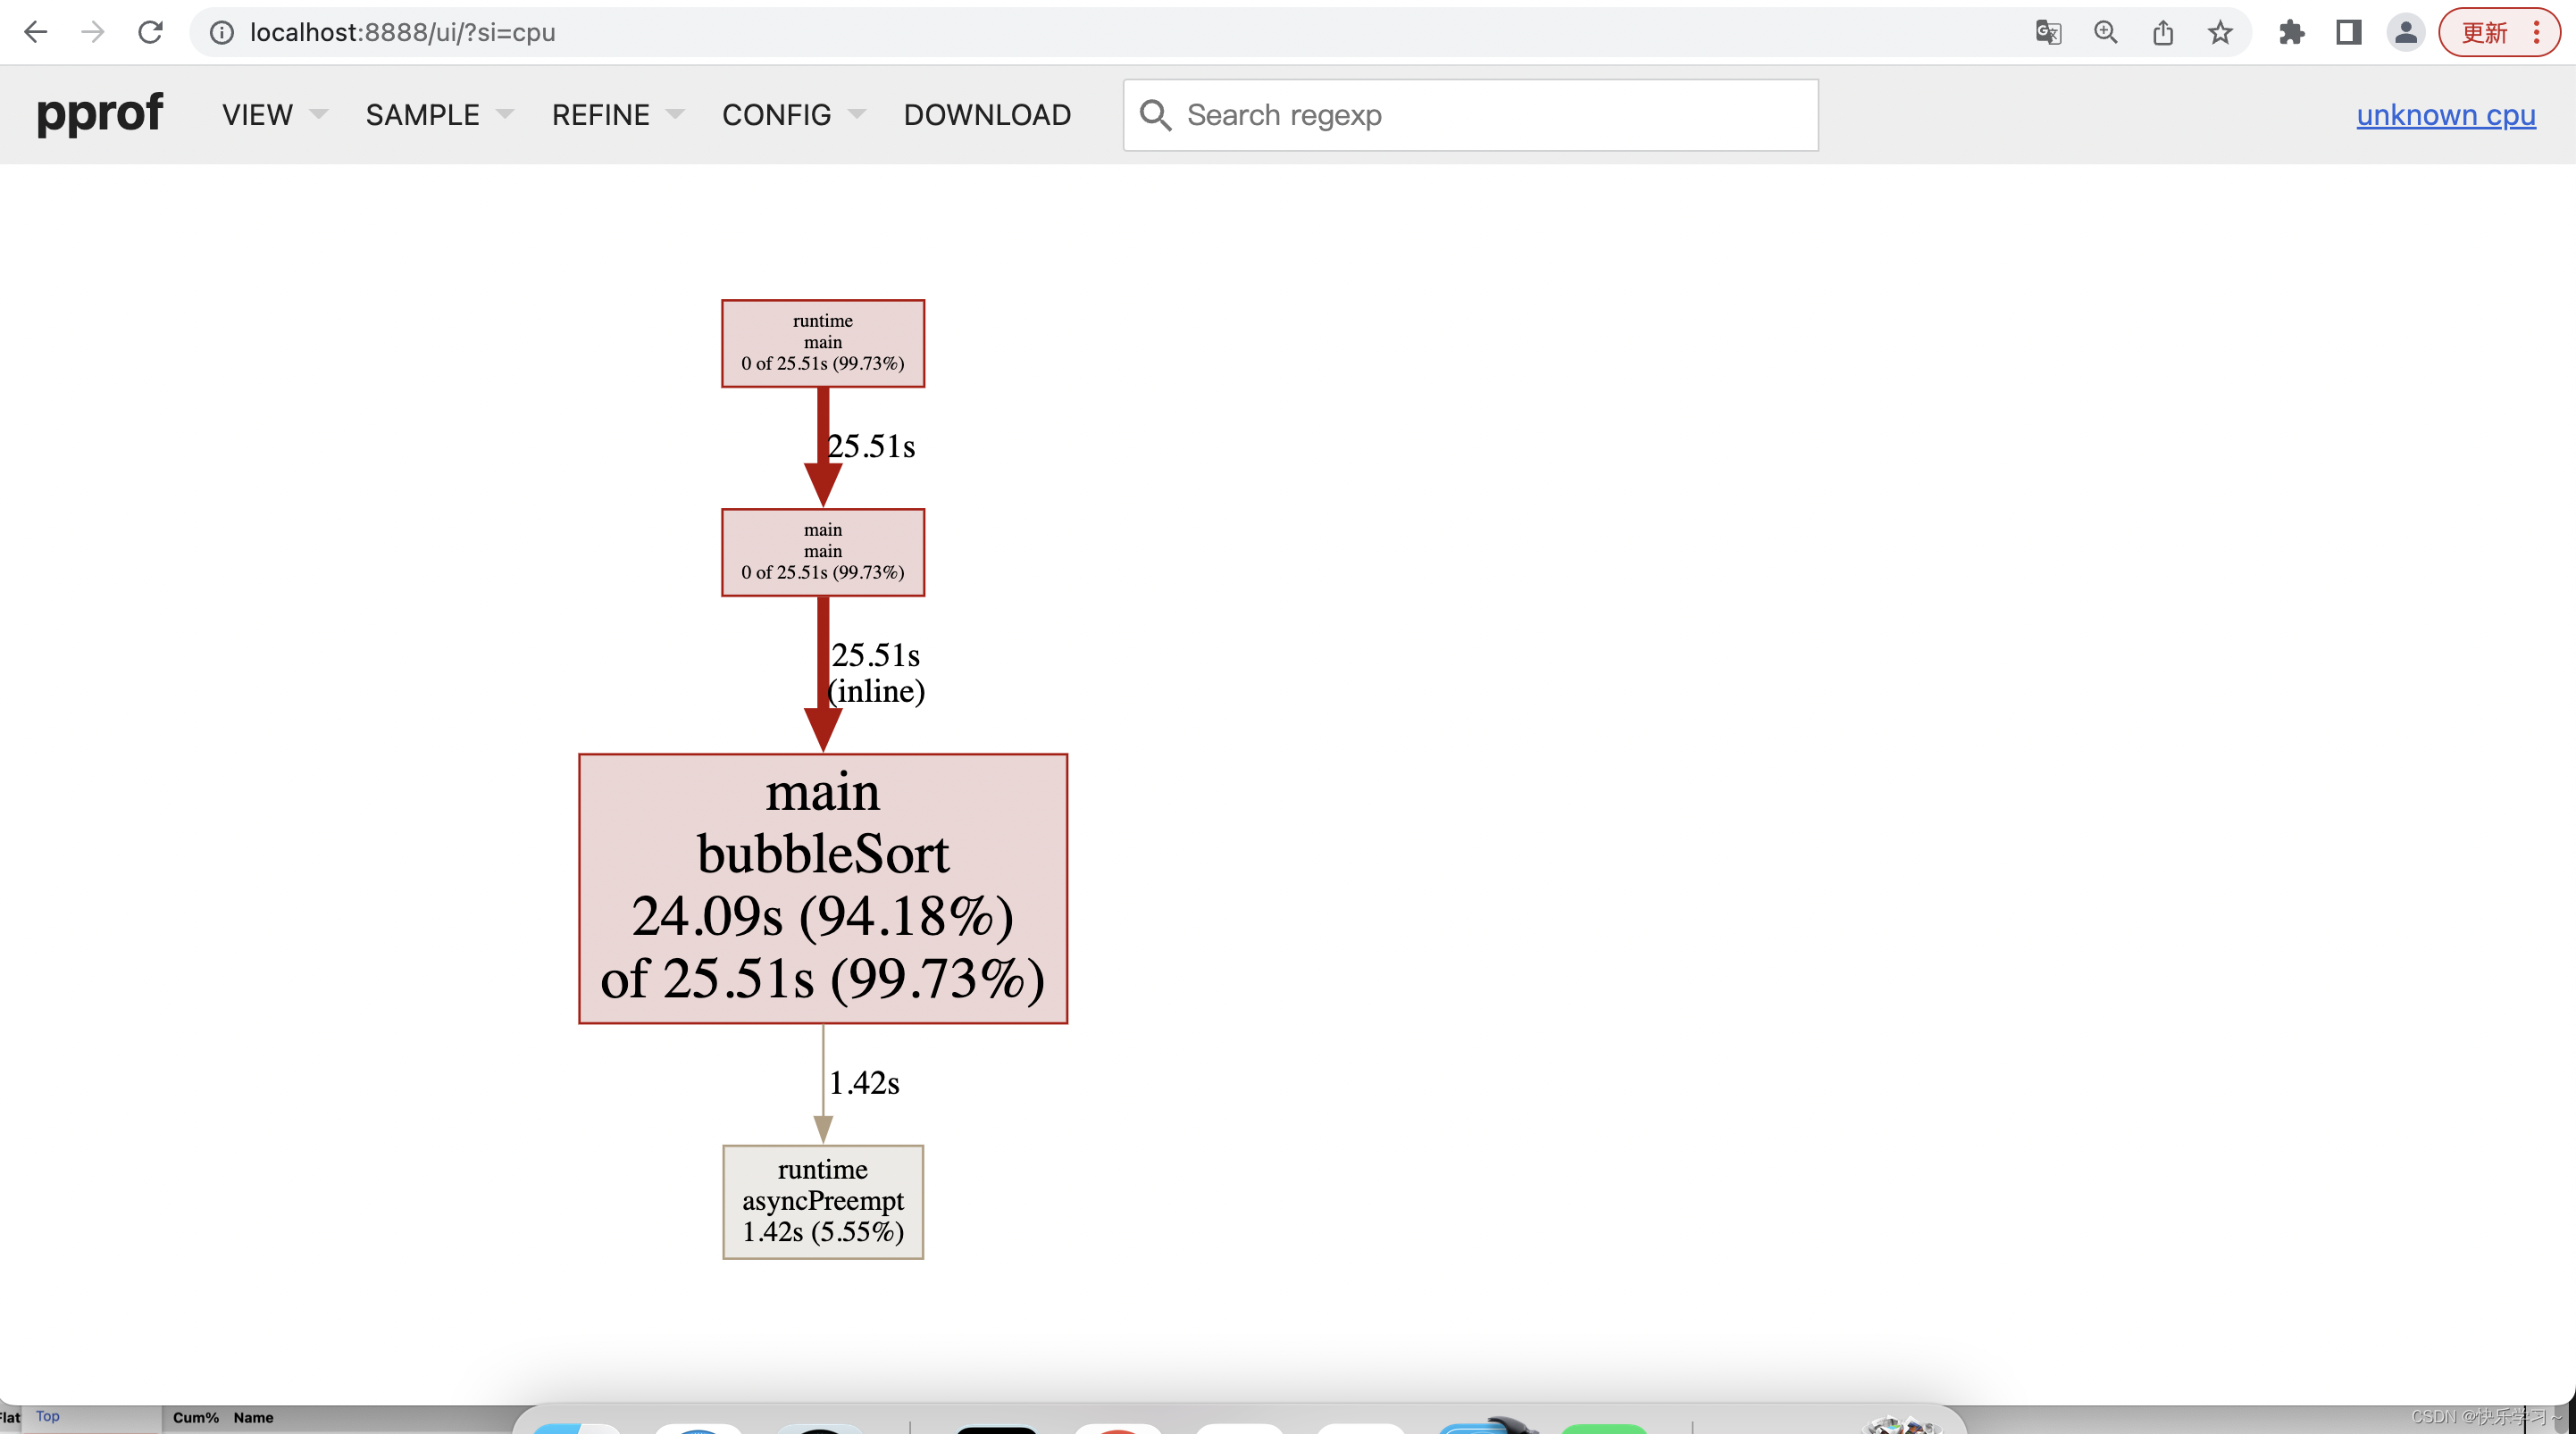
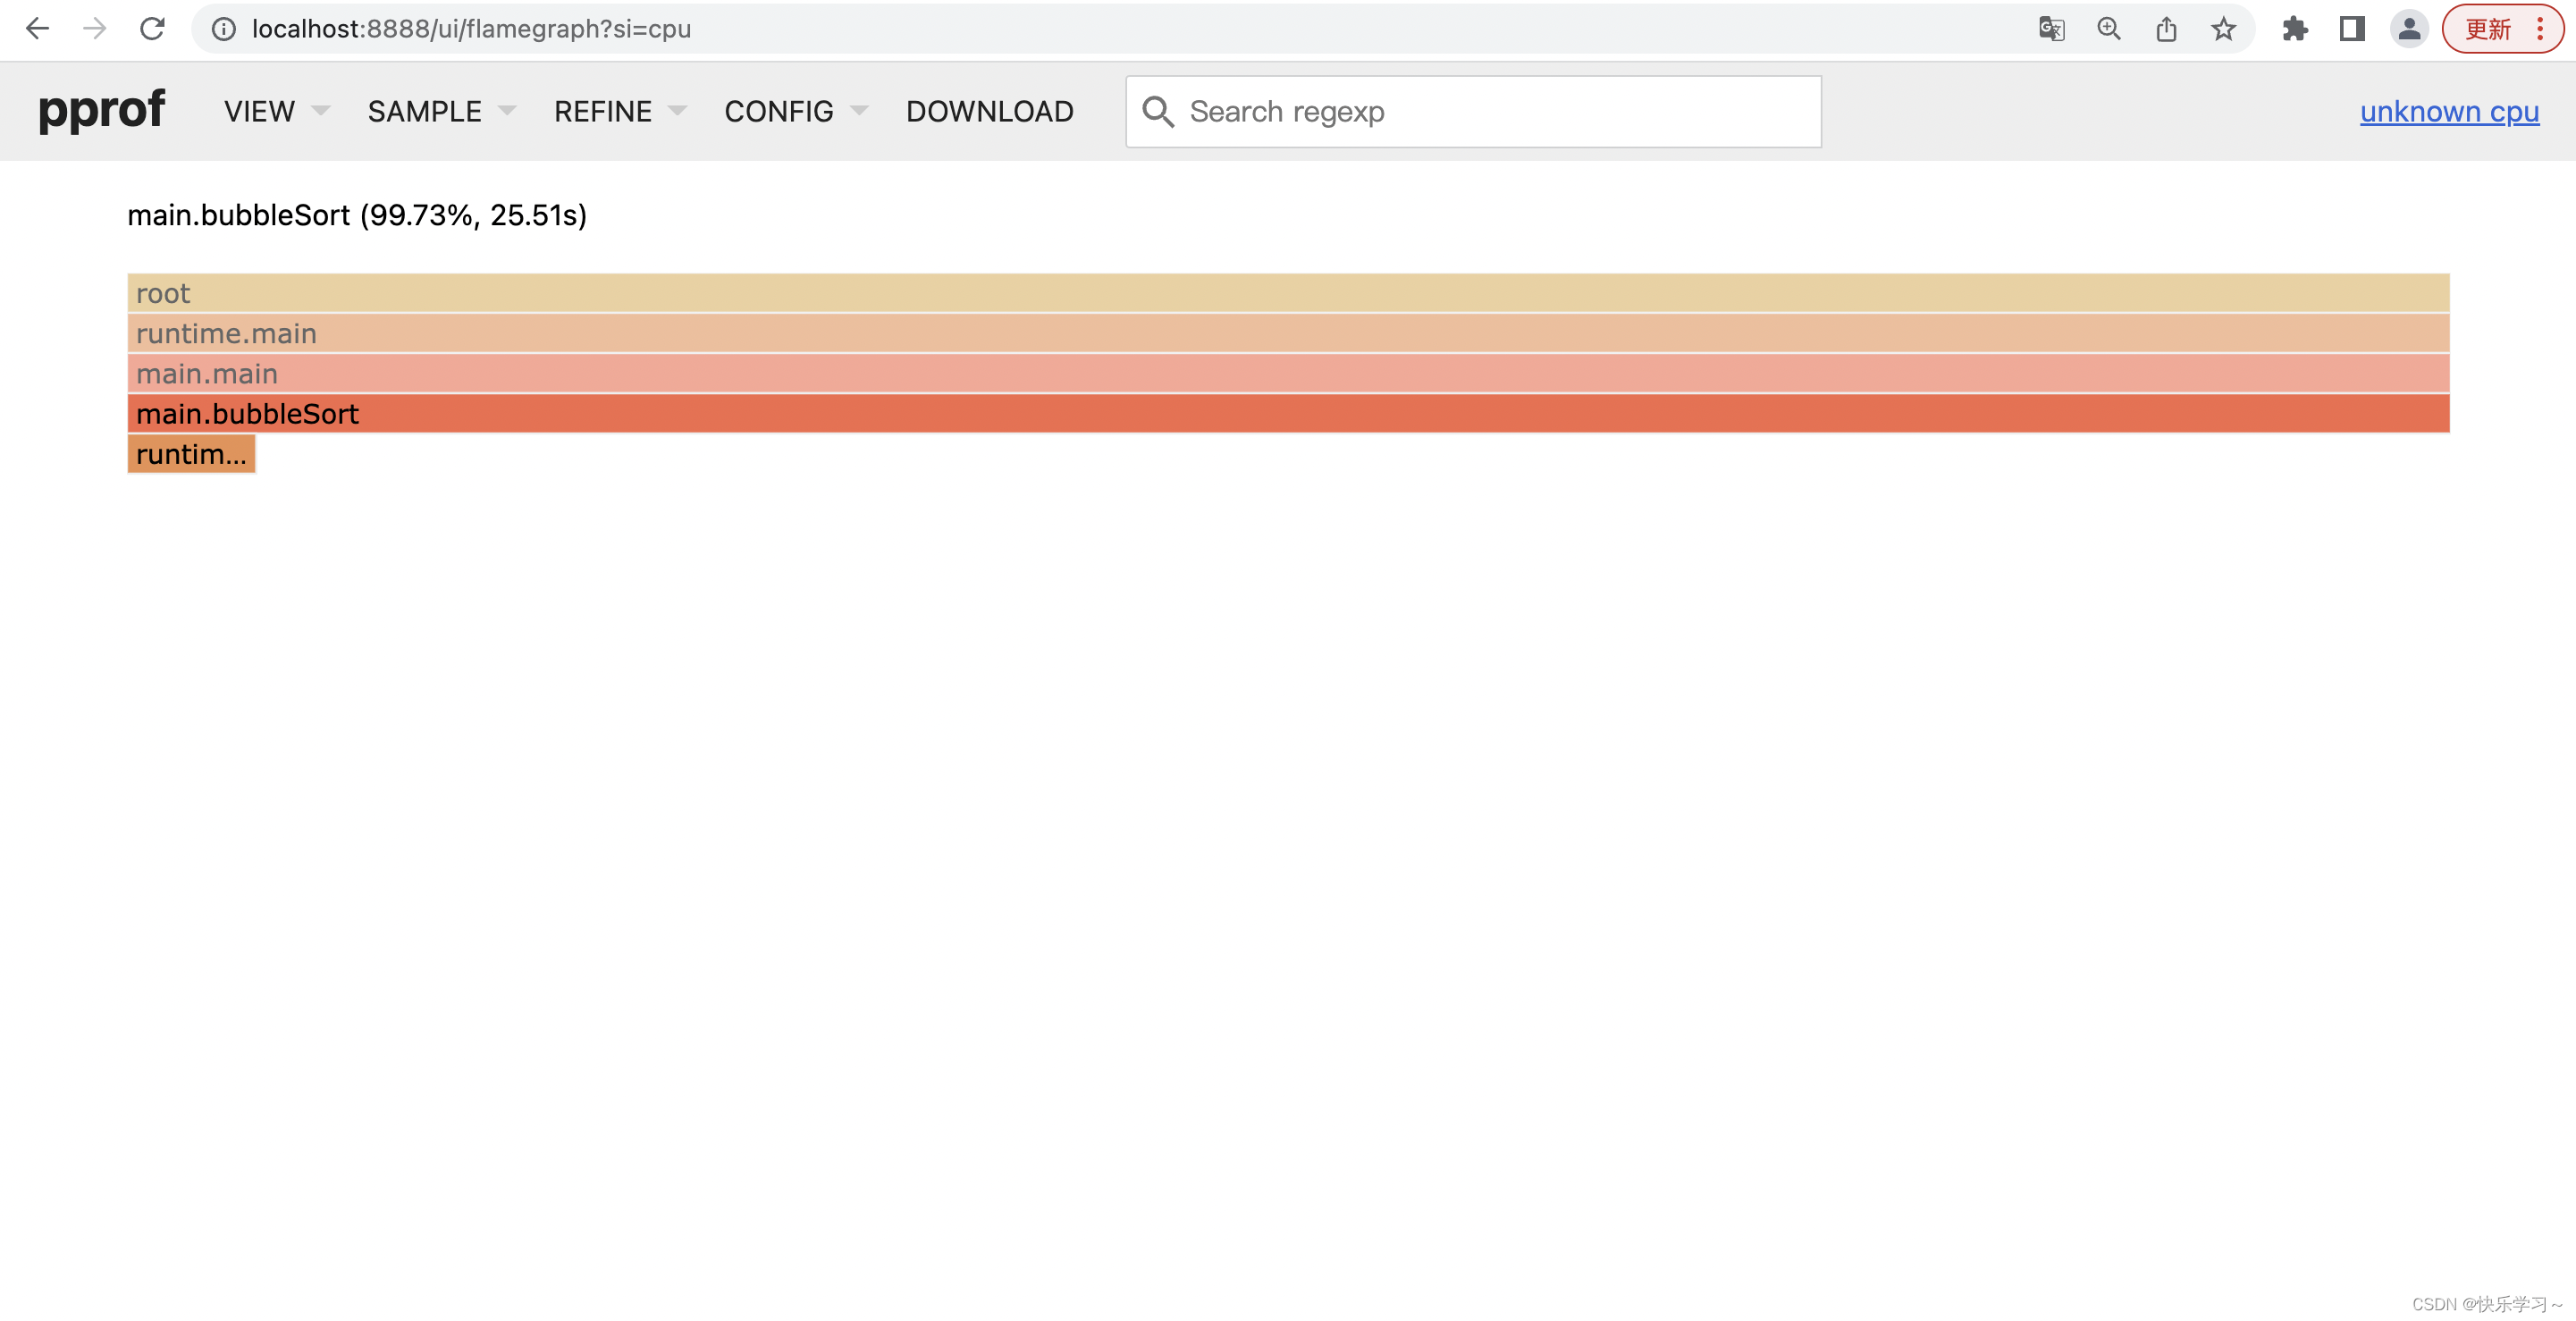
5、pprof ui方式查看cpu消耗火焰图
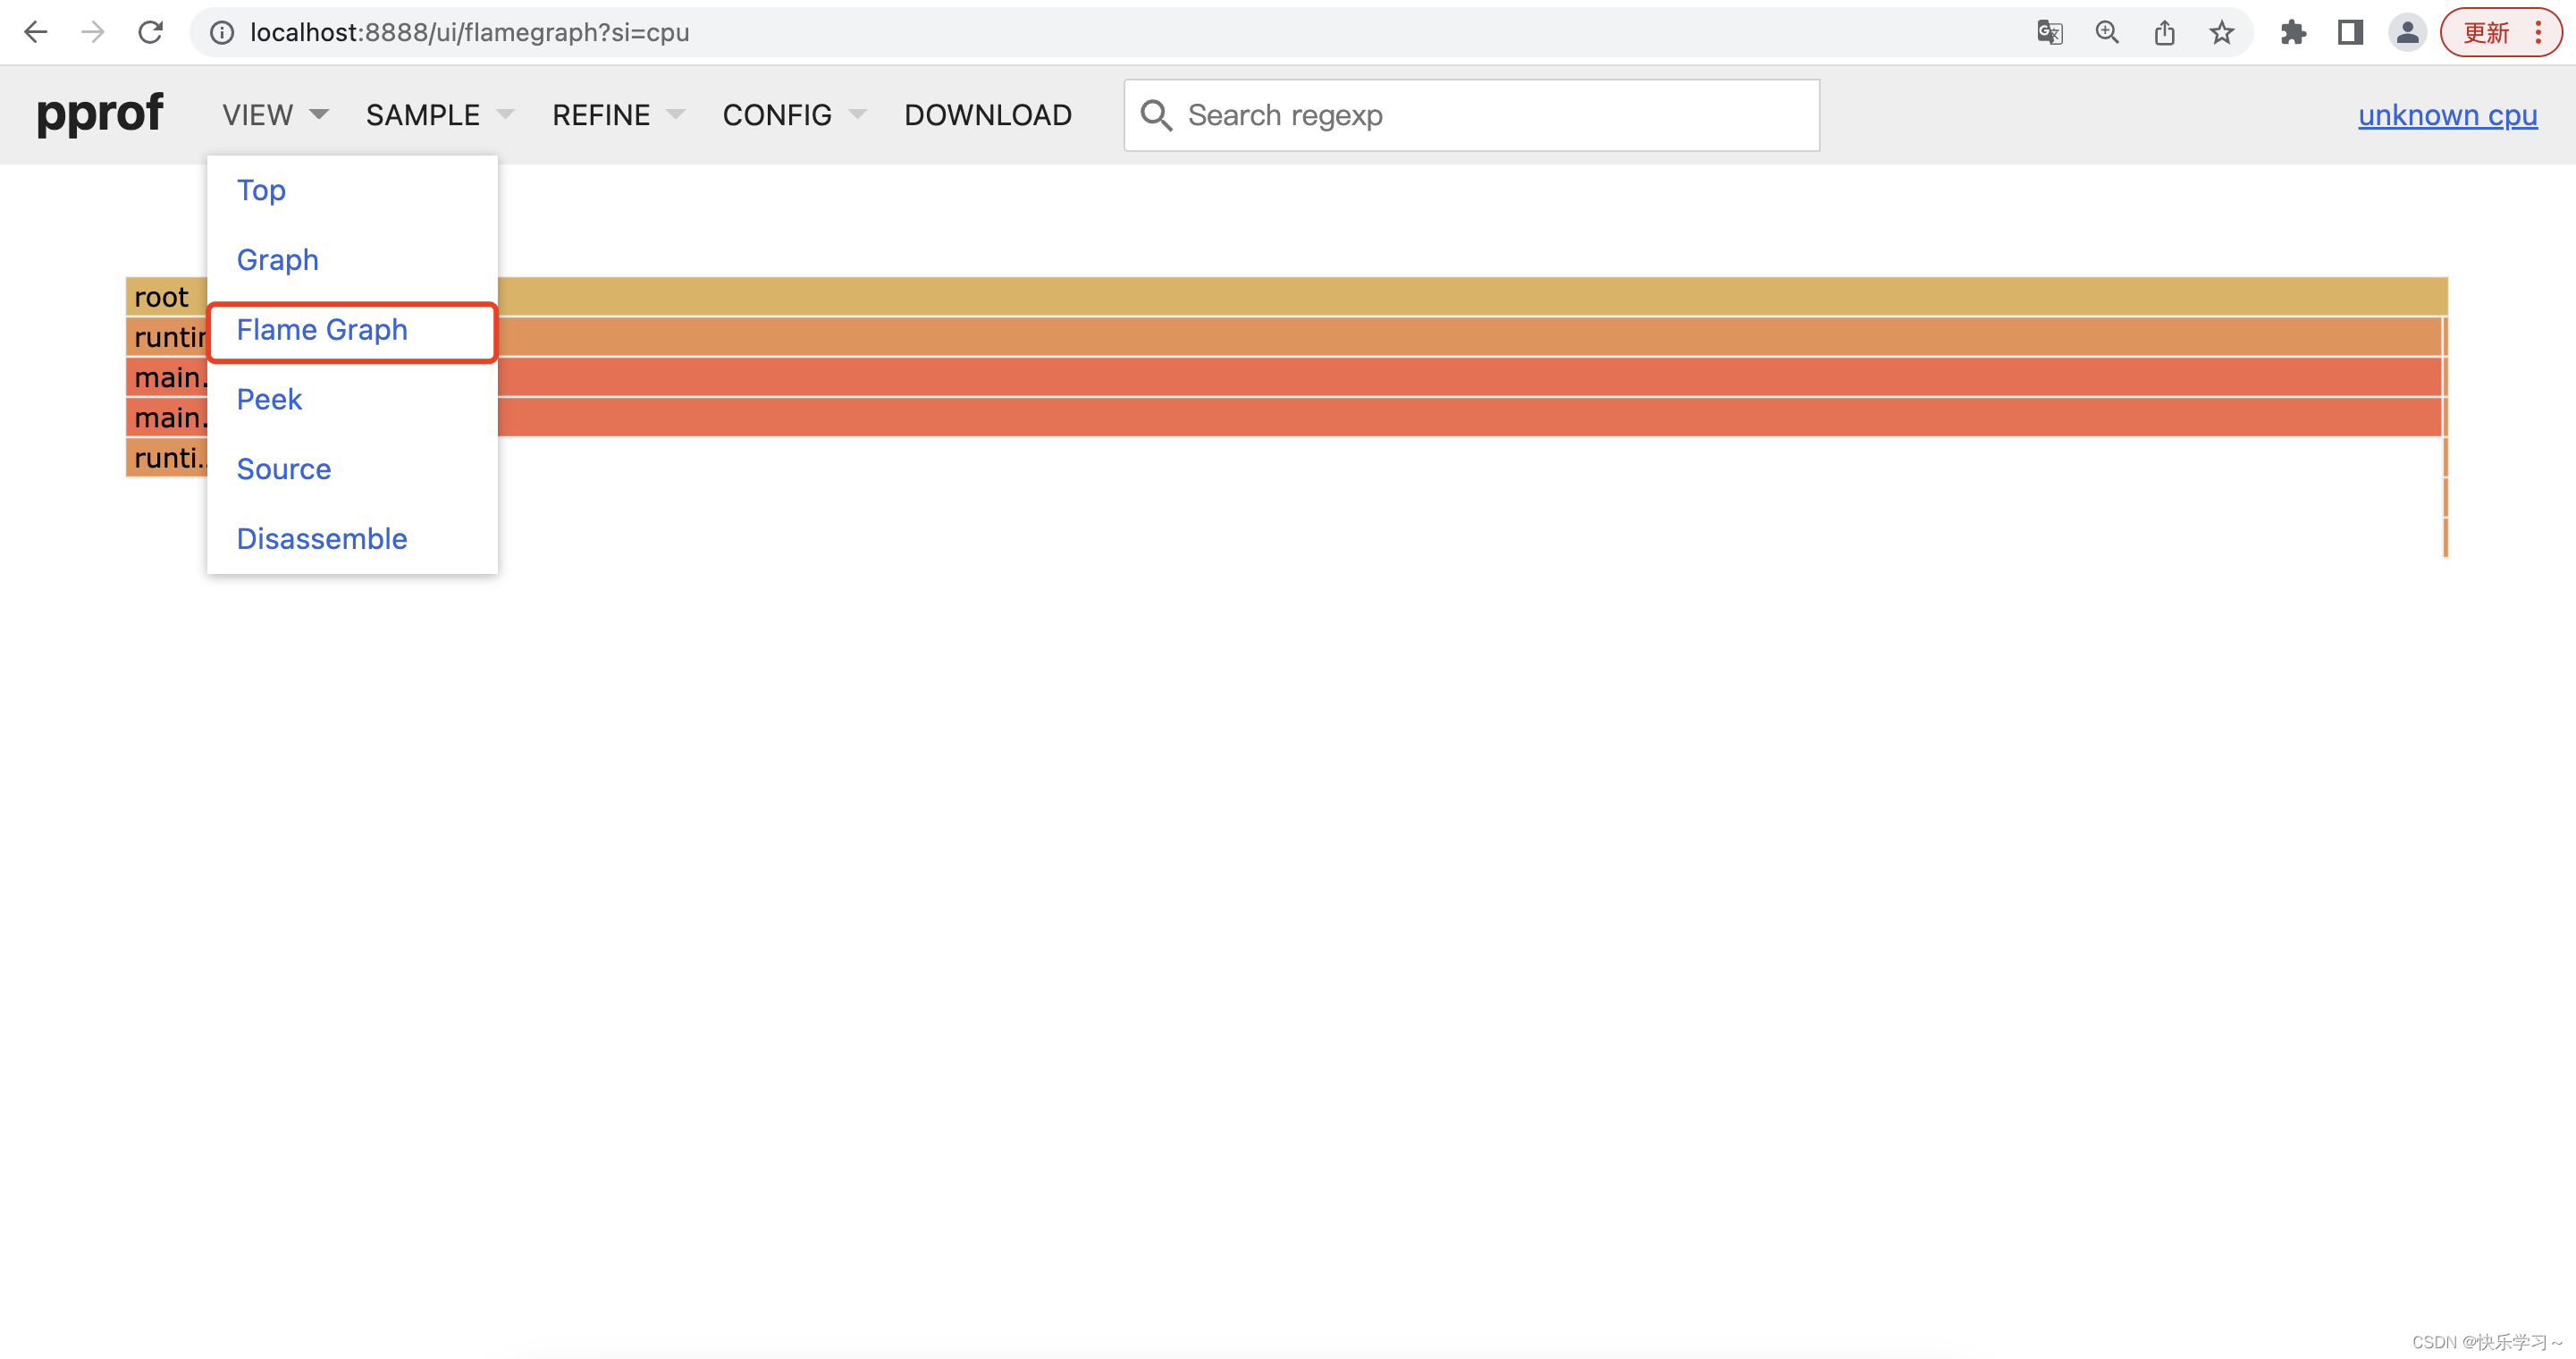
生成追踪图和火焰图需要安装graphviz
brew install graphviz
常用命令
// 查看cpu消耗前20的函数调用
top 20

// 查看累计cpu消耗前20的函数调用
top -cum 20

// 查看代码符号附近的cpu占用情况。其中代码符号类似于c++的函数符号表,可以简单理解成函数名
list "代码符号"
相关文章
- 博客添加暗色主题切换功能,从主题切换聊聊前后端cookies的使用
- 科普-为自己的博客免费加上小绿锁
- Typecho博客程序怎么开启Gzip压缩加速网站
- java程序员怎么创建自己的网站:第二章:个人博客网站
- 基于 Hexo 从零开始搭建个人博客(一)
- 开源项目 | 又一款简洁实用的个人博客系统
- 可能是最全的使用 HEXO 搭建个人博客教程
- wordpress统计某段时间用户发帖量-文曦博客
- WordPress 技巧:创建博客时不创建 links 表
- 分享 Linux 技术:一位热爱 Linux 的博客(linux技术博客)
- 亚马逊AWS推出专门面向量子计算的新博客频道
- 精通SQLServer:从博客中学习数据库知识(博客sqlserver)