
双侧检验Two-Tailed Test
Uses, Formula & Examples | What is a Two-Tailed Test? - Video & Lesson Transcript | Study.com
双侧检验,就是指当统计分析的目的是要检验样本平均数和总体平均数,或样本成数有没有显著差异,而不问差异的方向是否是正差还是负差时,所采用的一种统计检验方法。
应用
http://sthda.com/english/wiki/unpaired-two-samples-wilcoxon-test-in-r#:~:text=Infos%20The%20unpaired%20two-samples%20Wilcoxon%20test%20%28also%20known,used%20when%20your%20data%20are%20not%20normally%20distributed.
不能根据专业知识判断两种结果谁高谁低时,采用双侧检验。
如果检验的目的是检验抽样的样本统计量与假设参数的差数是否过大(无论是正方向还是负方向),就把风险平分在右侧和左侧。比如显著性水平为0.05,即概率曲线左右两侧各占一半,即0.025。
Two-Tailed Test in Statistics
In statistics, significance tests are used to determine if there is a statistically significant difference between observed values and the expected values of a statistical experiment. In any experiment, it is possible to have differences between observed and expected values. Significance tests provide the evidence of whether the difference occurs because of random factors or if it is unlikely that the difference is purely because of random factors.
For example, a breakfast cereal company produces boxes of cereal. On average, each box is 200 grams. Sixty boxes of cereal were chosen randomly and weighed. It is found that on average each box contains 185 grams of cereal. There is a 15 gram difference between observed and expected values. Is this an acceptable difference? Is the difference too high, and is there something in the production line that needs to be corrected? As neither extreme (extremely higher or lower than the expected average weight) is desired, a two-tailed test will need to be conducted. The null hypothesis for the weight of each cereal box is
{eq}H_{0} {/eq}: The mean weight of a cereal box is {eq}\mu {/eq}=200g
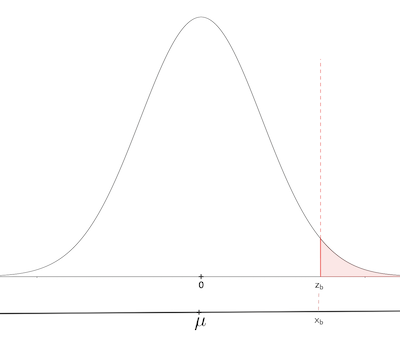
A two-tailed test compares the sample and population means to identify if the difference between their means is statistically significant. Although both population and sample are assumed to be normally distributed, their means are different. To compare the two standard normal distributions, z-scores will need to be used. In Figure 1, the standard normal distribution curve represents the two-tailed test. If the result of the two-tailed test falls into the unshaded region, then it means there is not enough evidence to reject the null hypothesis. In the case of cereal boxes, there is not enough evidence to say the sample mean is different from 200 grams, or in other words, the difference between the sample and the population means is not statistically significant. If the two-tailed test results fall into the shaded regions, which are also called the rejection regions, then there is enough evidence to reject the null hypothesis, and the factory manager needs to check the process of production and make changes.
Figure 1 Rejection regions for two-tailed test of mean
Another important aspect in significance testing and two-tailed testing is the significance level, which is also known as the p-value. It represents the probability of obtaining test results at least as extreme as the results observed, under the assumption that the null hypothesis is correct. In Figure 1, it is the shaded regions that represent this probability. Because two-tailed statistics is represented in the graph, each shaded region has a probability equal to {eq}\frac{p}{2} {/eq}.
Also, in Figure 1, z-scores corresponding to each tail {eq}\frac{p}{2} {/eq} are {eq}z_{a}\: and\; z_{b} {/eq} (or corresponding x values {eq}x_{a}\: and\; x_{b} {/eq}) are called critical values, and regions are called critical regions.
In summary, two tailed statistics is used if there is a statistically significant difference between the sample mean and the population mean.
Two-Tailed vs One-Tailed Tests
For example, a factory produces smartphone batteries with a mean life of 10 hours. If a sample of 35 batteries has a mean life of 8 hours, is it significantly less than the expected mean?
{eq}H_{0} {/eq}: The mean life of the batteries is {eq}\mu {/eq}=10 hrs
{eq}H_{a} {/eq}: the mean life of batteries is fewer than 10 hours, {eq}\mu {/eq}<10 hrs
In this case, a one-tailed significance test is suitable, as the question is asking, "Is it significantly less than the expected mean?" In Figure 2, this case is represented with a left-tailed rejection region under the curve of standardized normal distribution.
Figure 2: Left-tail significant testing of means and rejection region
Another example of a one-tailed test would be for a course for four-year-old children which claims to be improving their memory. On average, the children can remember seven of the ten pictures shown to them correctly. After they have taken the course, they remember eight pictures out of ten on average. Is there enough evidence to say the course has improved their memory?
In this case, a right-tailed test would be more suitable, as the question of the research is to find if the course has increased memory, as seen in Figure 3.
Figure 3: Right-tailed test for mean and rejection region
Two-Tailed Test Formula
The steps of two-tailed test statistics are as follows:
- The sample size needs to be large enough to perform significance testing (statistically acceptable minimum is n=30).
- State the null and alternative hypothesis, where the null hypothesis is that the sample mean is equal to the population mean, and the alternative hypothesis is they are not equal.
- Identify the significance level (p-value).
- Find the critical values using the standard normal distribution table (area beyond z for the right tail of the graph).
- Perform the test and find z-scores for observed values.
- If the z-score falls into the critical region, reject the null hypothesis.
If
{eq}n: {/eq} sample size
{eq}\sigma {/eq}: standard deviation
{eq}\bar{x} {/eq}: sample mean
{eq}\mu {/eq}: the population mean
The two-tailed test formula to find the z-score is
{eq}z=\frac{\bar{x}-\mu }{\sigma/\sqrt{n}} {/eq}
In this formula, {eq}\frac{\sigma}{\sqrt{n}} {/eq} represents the standard error of the sampling distribution.
As mentioned above, the z-score is compared to the p-value and the rejection region. Fifteen percent (0.05) or one percent (0.01) are commonly used p-values. For example, if 0.01 is used, it means that only 1 time in 100 the null hypothesis is rejected when it should have been accepted. Therefore, a smaller p-value means the chance of rejecting the null hypothesis when it should not be rejected is smaller. The significance level needs to be decided before the test is performed based on the set criteria by the researcher.

Timeline
Autoplay
14K views
To unlock this lesson you must be a Study.com Member. Create your account
Frequently Asked Questions
When would you use a two-tailed test?
A two-tailed test is used to identify if the mean of the expected values is significantly different than the mean of the observed values. This means that it is testing whether the means are equal, more, or less; and both tail ends of the normal distribution are considered.
What is the difference between a one-tailed test and a two-tailed test?
For both two-tailed and one-tailed tests, the null hypothesis is that the mean of the population is equal to the mean of the observed values.
In a one-tailed test, the alternative hypothesis is that the mean is smaller (or greater) than the expected mean.
In the two-tailed test, the alternative hypothesis is that the mean of the population is different from the observed mean.
What is an example of a two-tailed test?
The two-tailed test identifies if the difference between the sample mean and the population mean is statistically significant. For example, if a new teaching method of statistics is to be used in schools, it is important to use a two-tailed test to identify if there is a statistically significant difference in both ends of the distribution to see if the new method produced similar, higher, or lower scores than the previous method.
相关文章
- Gradle学习之书籍《Build and Test with Gradle》之chapter2:Gradle task任务
- 深入了解VSTS的Unit Test测试属性
- 机器学习入门06 - 训练集和测试集 (Training and Test Sets)
- [Unit Testing] Test async function with Jasmine
- [Testing] Config jest to test Javascript Application -- Part 1
- [Unit Test for Zombie] 05. Integration Tests
- [Javascript] Test you code proferemce!! SpeedTestClass
- test
- [Unit Testing] Angular Test component with required
- Linux shell test命令用法详解
- Atitit 锁的不同层级 app锁 vm锁 os锁 硬件锁 目录 1. 在硬件层面,CPU提供了原子操作、关中断、锁内存总线的机制1 1.1. test and set指令1 1.2. 锁内
- ML之chi-square:卡方检验(chi-square test)的简介、代码实现、使用方法之详细攻略
- 成功解决Fit Failed Warning: Estimator fit failed. The score on this train-test partition for these param
- 【项目实战】SpringBoot多环境(dev、test、prod)配置
- Python Unit Test - Test Report: HTMLTestRunner -1
- 解决Vscode使用LeetCode报错Failed to test the solution. Please open the output channel for details.
- Phoronix测试套件(Phoronix Test Suite,PTS)介绍
- 嵌入式linux开发,交叉编译qt4.8.5报错:bin/qmake: Exec format errorThe tslib functionality test failed! You migh