
scATAC-seq入门必看 染色质可及性 archr官网全流程
A Brief Tutorial of ArchR • ArchR 这个是简单版本
1.5 Getting Set Up | ArchR: Robust and scaleable analysis of single-cell chromatin accessibility data.经典必看 我已经看了两边
Chapter 4 Dimensionality Reduction with ArchR | ArchR: Robust and scaleable analysis of single-cell chromatin accessibility data.In ArchR, these visualization methods are referred to as embeddings.
One of the key inputs to LSI dimensionality reduction is the starting matrix. Thus far, the two main strategies in scATAC-seq have been to (1) use peak regions or (2) genome-wide tiles.
Gene Scores and Marker Genes with ArchR 先验知识 如何识别出markergene 既然atac都没有
7.1 Calculating Gene Scores in ArchR | ArchR: Robust and scaleable analysis of single-cell chromatin accessibility data.genescores是什么 怎么计算出来的? 可以理解为基因得分,虽然atac测得是可及性,但通过距离tss位点的远近 可以算出genescores
marker基因是如何识别出来的 具体原理
markersGS <- getMarkerFeatures(
    ArchRProj = projHeme2,
    useMatrix = "GeneScoreMatrix",
    groupBy = "Clusters",
    bias = c("TSSEnrichment", "log10(nFrags)"),
    testMethod = "wilcoxon"
)
这个参数相当于按照什么标准来找marker gene
useMatrix = "GeneScoreMatrix"这个参数相当于以什么为背景
bias = c("TSSEnrichment", "log10(nFrags)"),
MAGIC方法对genescores进行impute 赋予其权重 让图更鲜明 好看
看markergene在染色体上的位置
markerGenes  <- c(
    "CD34", #Early Progenitor
    "GATA1", #Erythroid
    "PAX5", "MS4A1", #B-Cell Trajectory
    "CD14", #Monocytes
    "CD3D", "CD8A", "TBX21", "IL7R" #TCells
  )

p <- plotBrowserTrack(
    ArchRProj = projHeme2,
    groupBy = "Clusters",
    geneSymbol = markerGenes,
    upstream = 50000,
    downstream = 50000
)
grid::grid.newpage()
grid::grid.draw(p$CD14)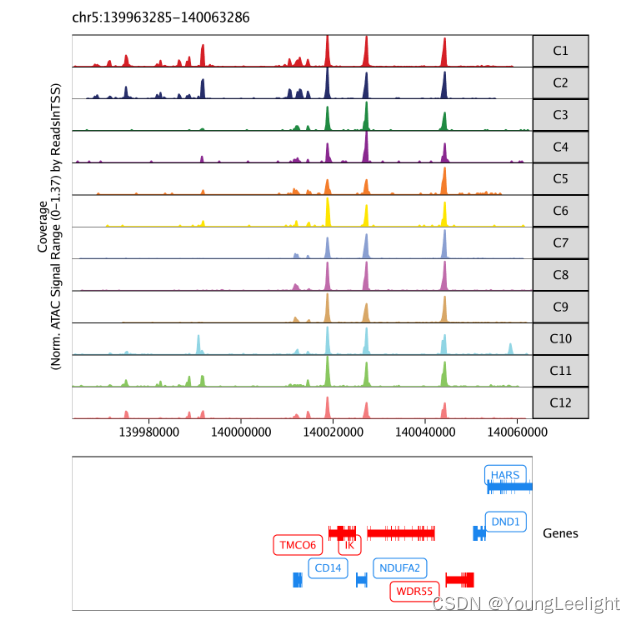
本地 嵌入shiny查看
跨平台数据整合 整合scRNA-seq
The way this integration works is by directly aligning cells from scATAC-seq with cells from scRNA-seq by comparing the scATAC-seq gene score matrix with the scRNA-seq gene expression matrix.
如何定义每个cluster的细胞类型 通过整合genescores 和scRANseq的gene expression

两种整合方法
Unconstrained integration is a completely agnostic approach that would take all of the cells in your scATAC-seq experiment and attempt to align them to any of the cells in the scRNA-seq experiment. While this is a feasible preliminary solution, we can improve the quality of our cross-platform alignment by constraining the integration process. To perform a constrained integration we use prior knowledge of the cell types to limit the search space of the alignment.
推断的基因表达与genescores化的图差不多
确定细胞类型 celltype
有点像impute 把同类型的细胞变成一个pseudo-bulk样本
The term pseudo-bulk refers to a grouping of single cells where the data from each single cell is combined into a single pseudo-sample that resembles a bulk ATAC-seq experiment.
自己定义每群细胞的取样比例 以及每群细胞可以产生多少个replications

With these pseudo-bulk replicates generated, we can now call peaks in our data.
As mentioned previously, we do not want to call peaks on the merged set of all single cells so having these more granular cell groups defined, either through clustering or otherwise, provides the ideal starting point for peak calling.
单个细胞不能call peaks 必须使用pseudo-bulk数据才可以callpeaks
软件内置了不同方法的call peaks
识别marker peaks
markersPeaks <- getMarkerFeatures(
    ArchRProj = projHeme5,
    useMatrix = "PeakMatrix",
    groupBy = "Clusters2",
  bias = c("TSSEnrichment", "log10(nFrags)"),
  testMethod = "wilcoxon"
)
11.2 Plotting Marker Peaks in ArchR | ArchR: Robust and scaleable analysis of single-cell chromatin accessibility data. 给marker peaks 画图 pheatmap
heatmapPeaks <- markerHeatmap(
  seMarker = markersPeaks,
  cutOff = "FDR <= 0.1 & Log2FC >= 0.5",
  transpose = TRUE
)
Marker Peak MA and Volcano Plots
Marker Peaks in Browser Tracks
p <- plotBrowserTrack(
    ArchRProj = projHeme5,
    groupBy = "Clusters2",
    geneSymbol = c("GATA1"),
    features =  getMarkers(markersPeaks, cutOff = "FDR <= 0.1 & Log2FC >= 1", returnGR = TRUE)["Erythroid"],
    upstream = 50000,
    downstream = 50000
)
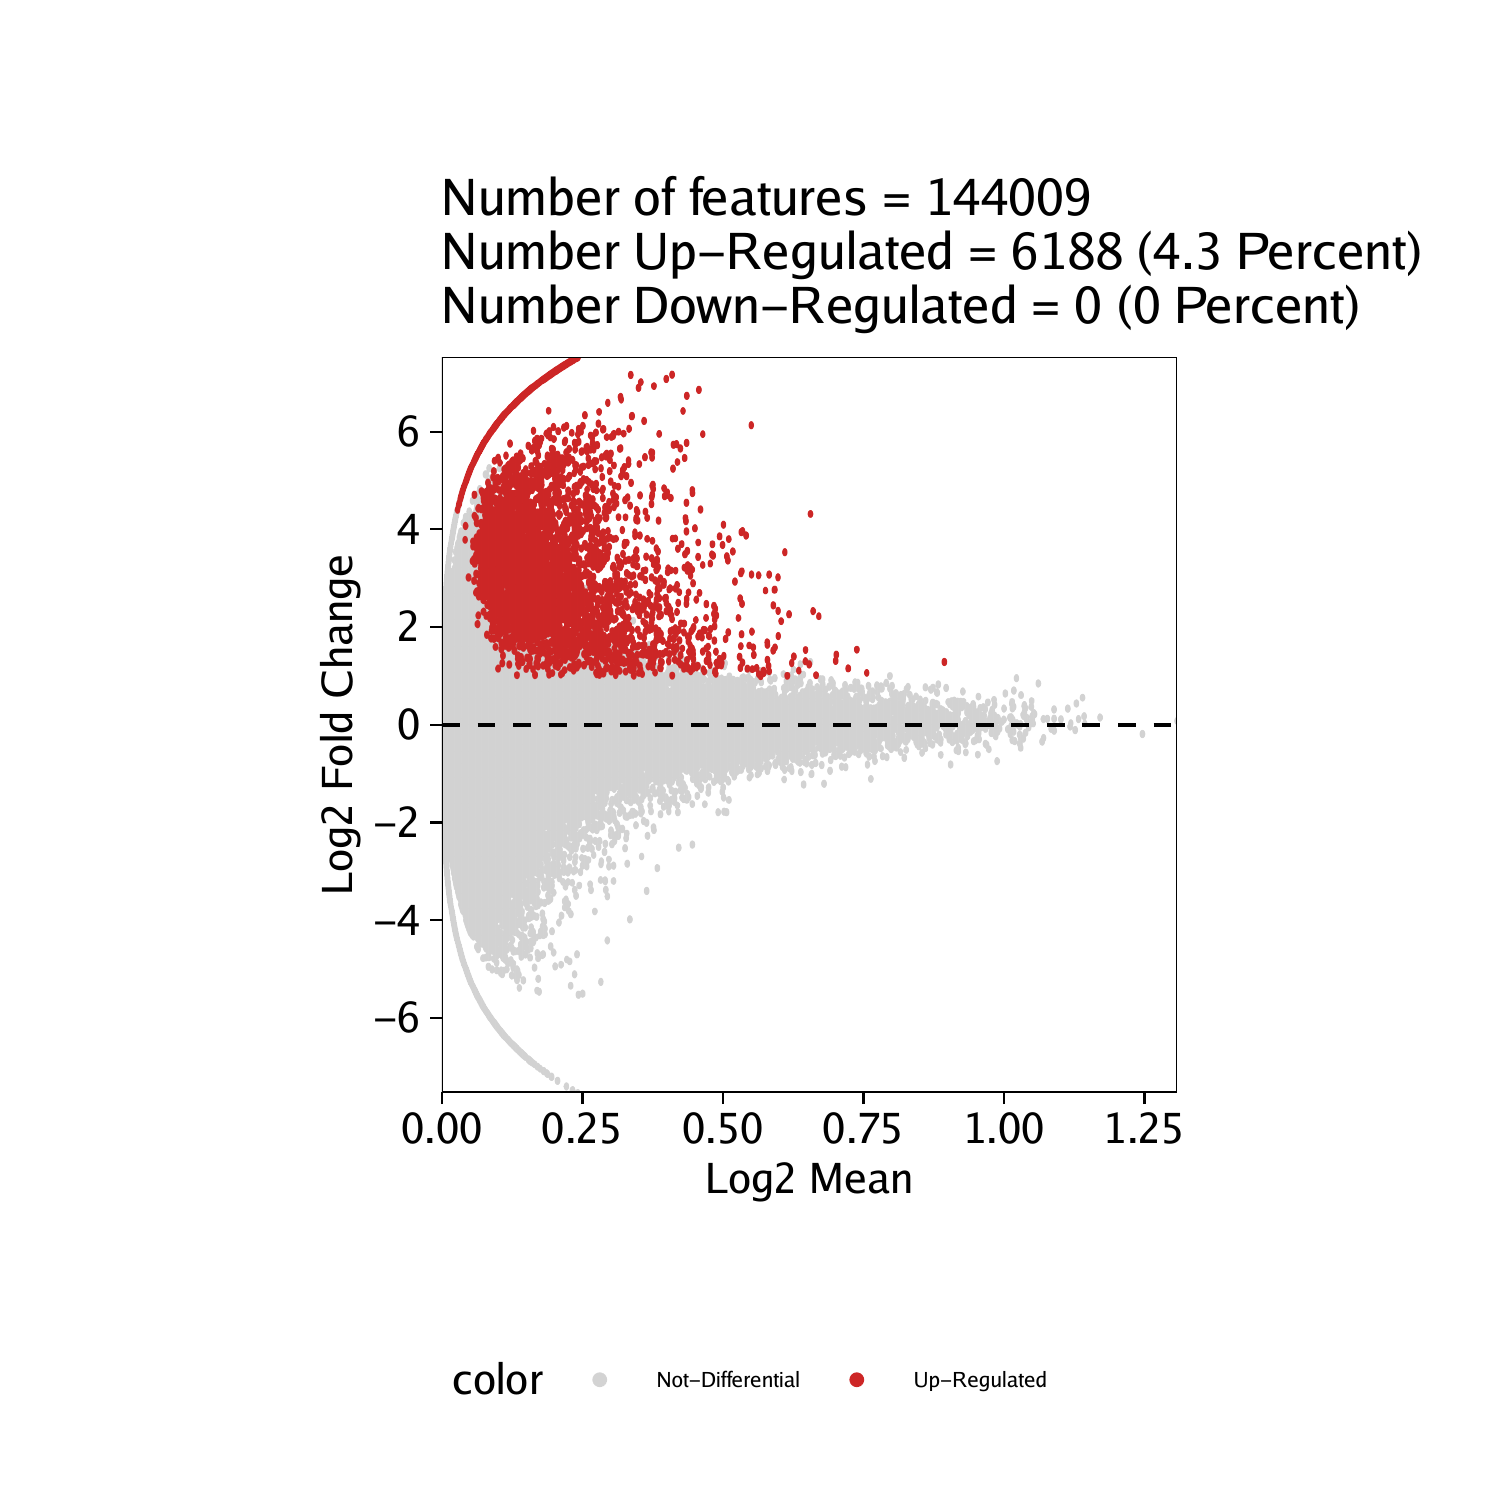
diffpeak差异分析火山图 volconIC plot

For example, we often find enrichment of key lineage-defining TFs in cell type-specific accessible chromatin regions. In a similar fashion, we might want to test various groups of peaks for enrichment of other known features.
基序富集分析
projHeme5 <- addMotifAnnotations(ArchRProj = projHeme5, motifSet = "cisbp", name = "Motif")motifsUp <- peakAnnoEnrichment(
seMarker = markerTest,
ArchRProj = projHeme5,
peakAnnotation = "Motif",
cutOff = "FDR <= 0.1 & Log2FC >= 0.5"
)
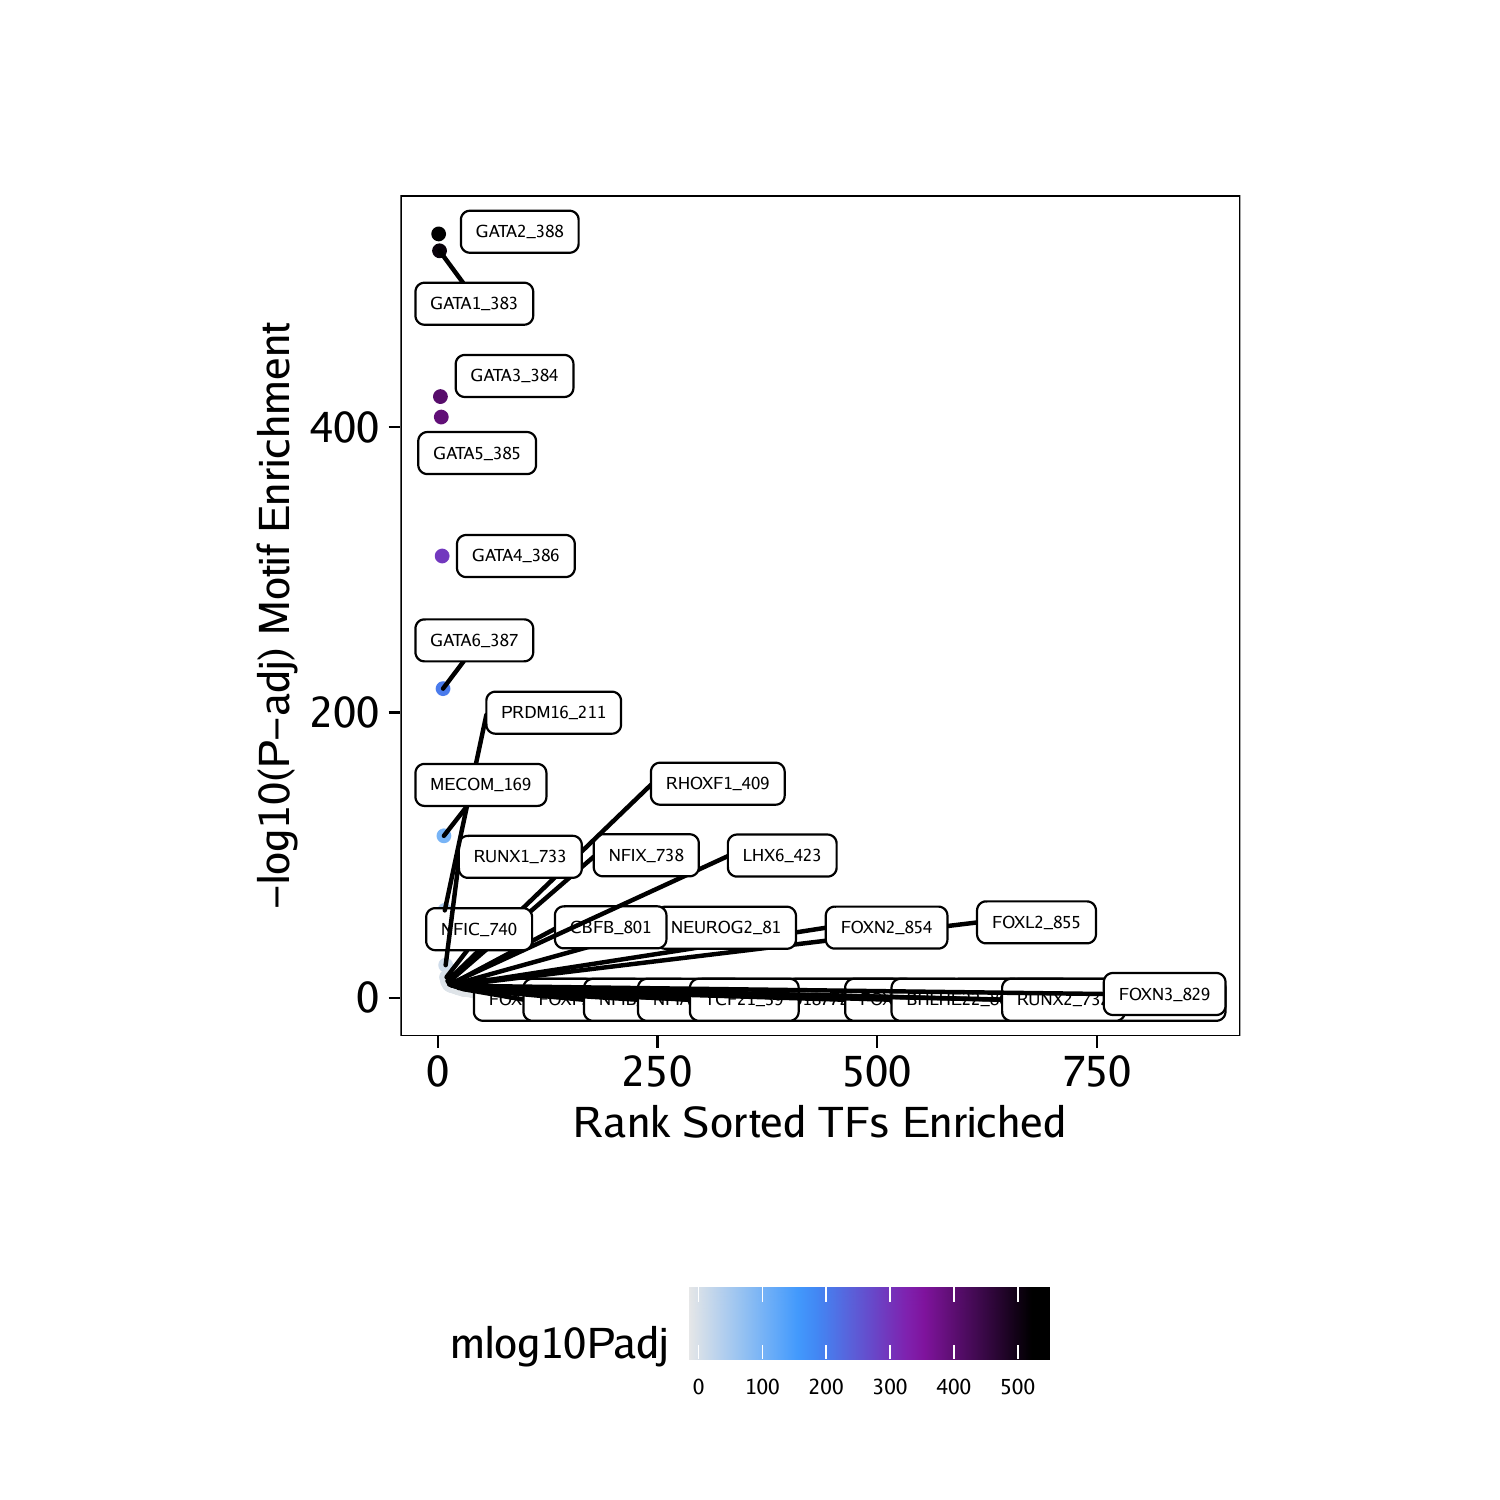
marker peak的基序富集
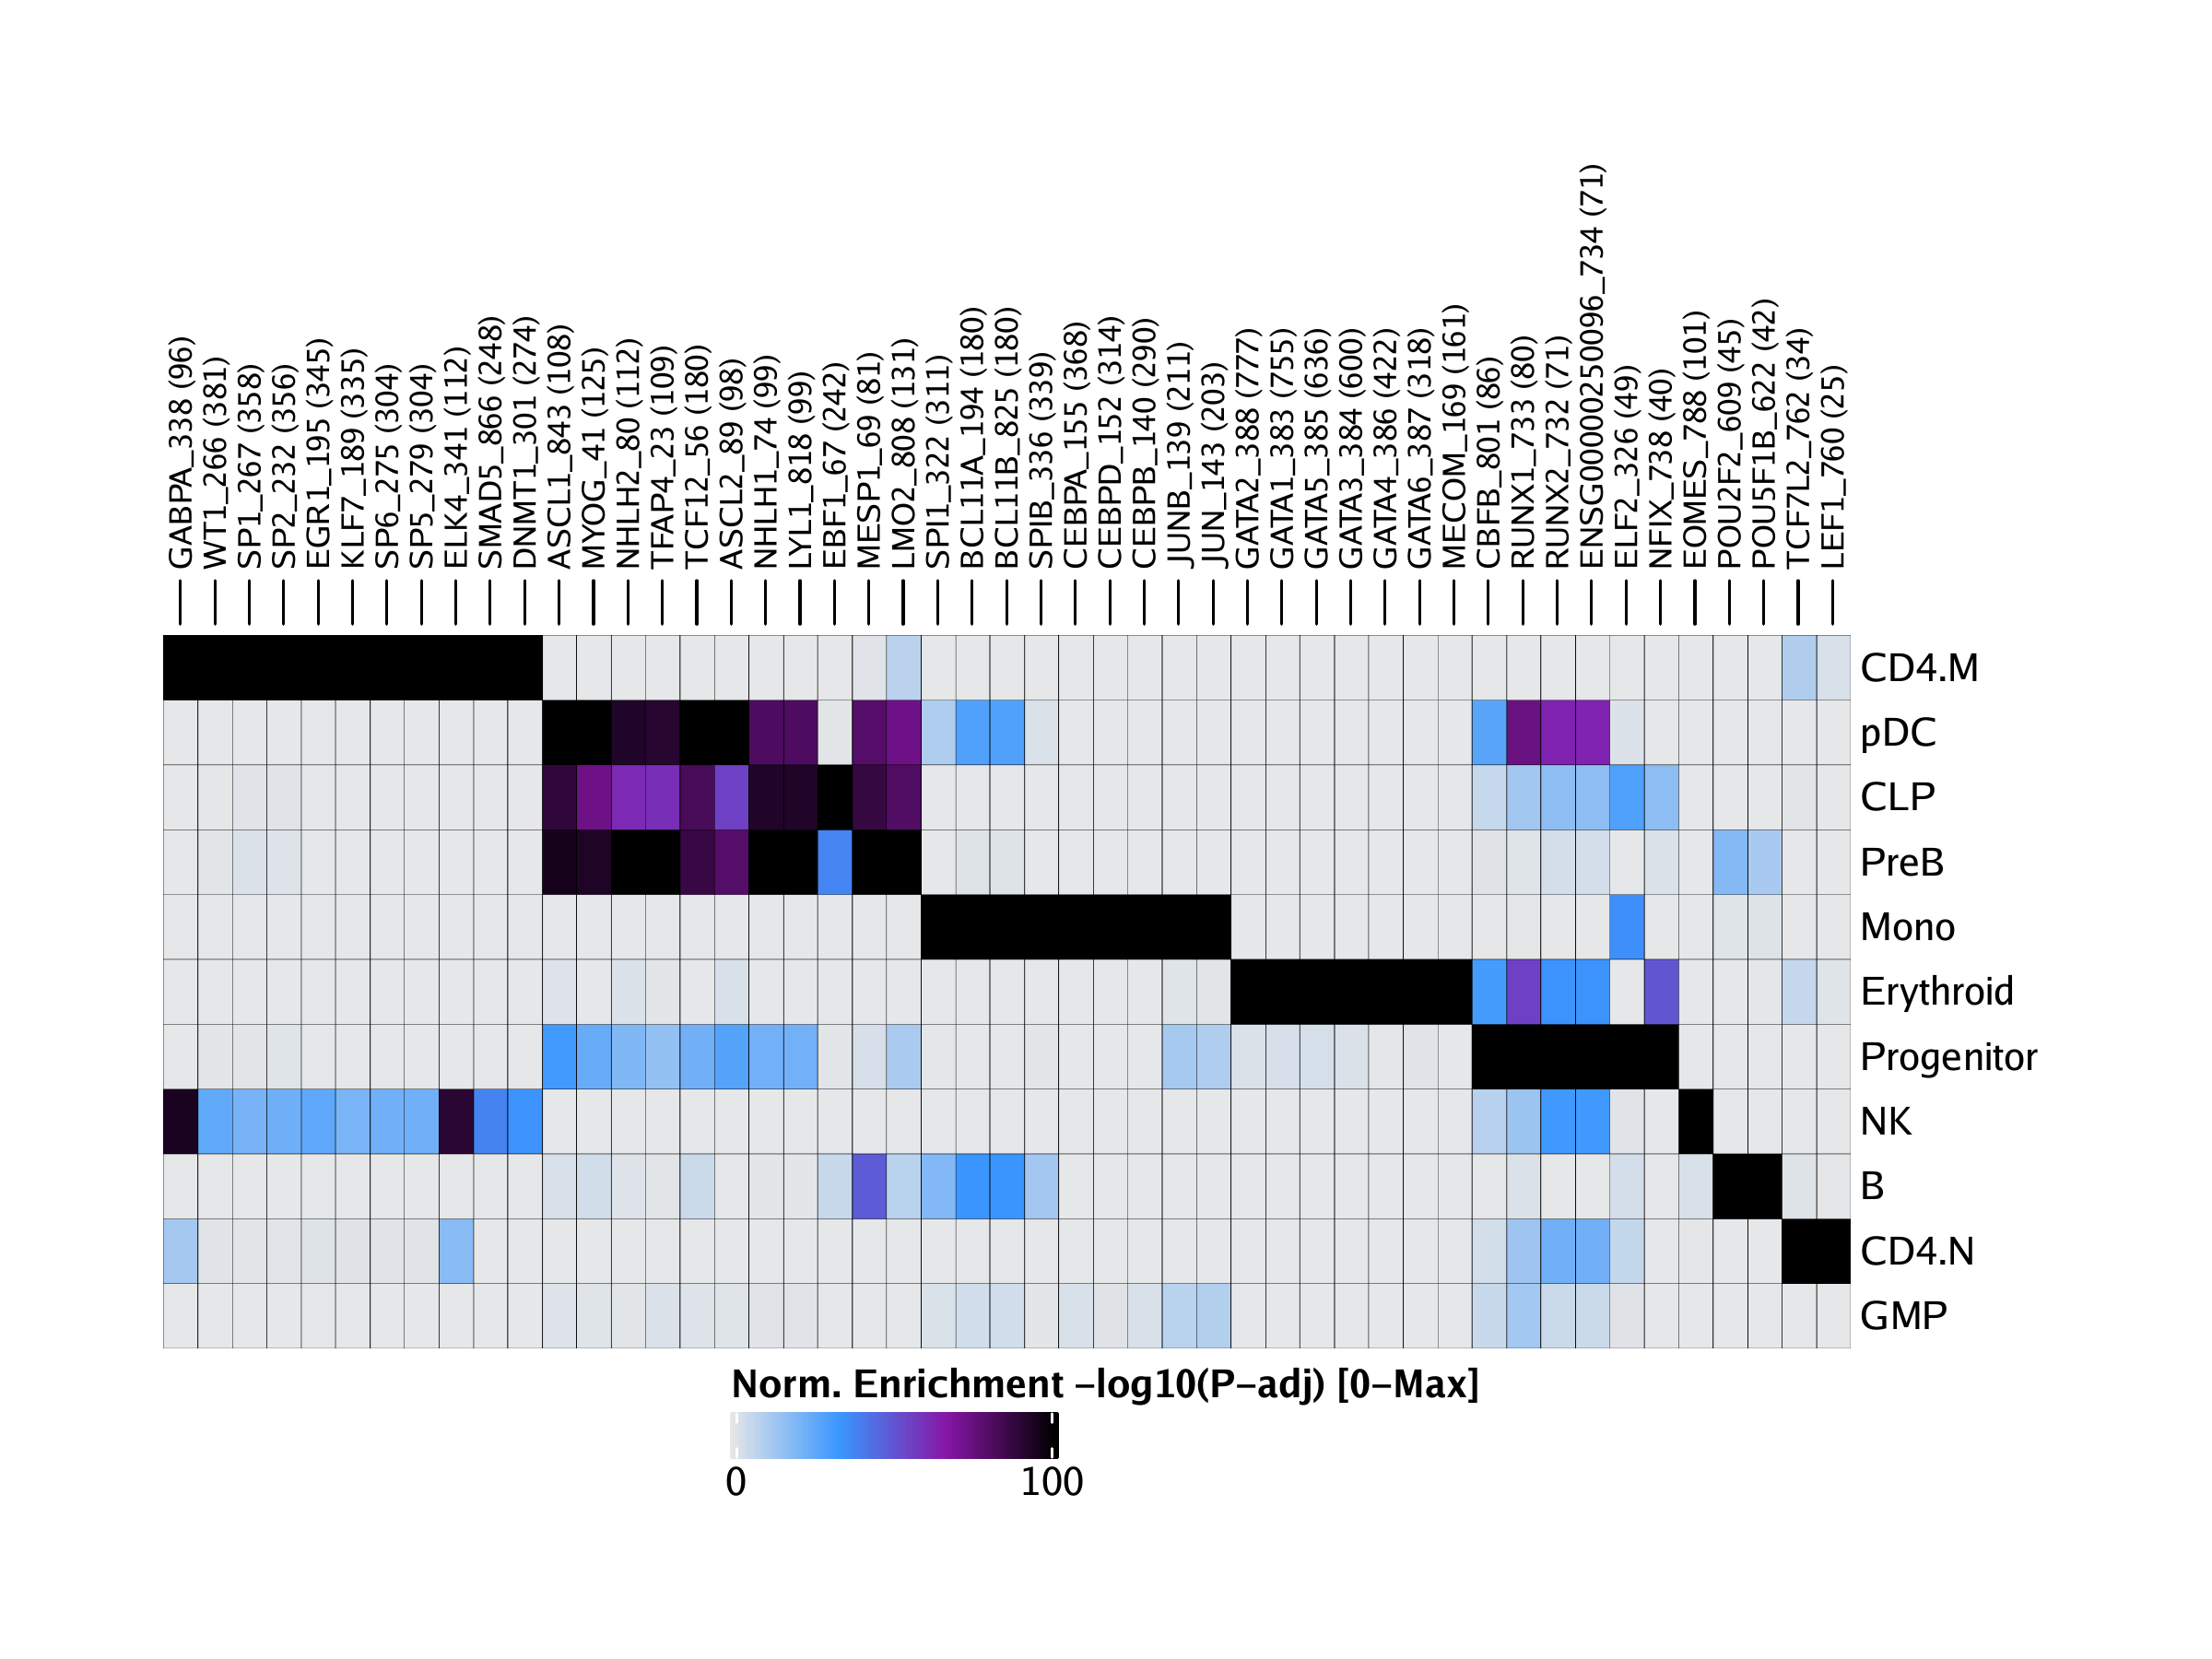
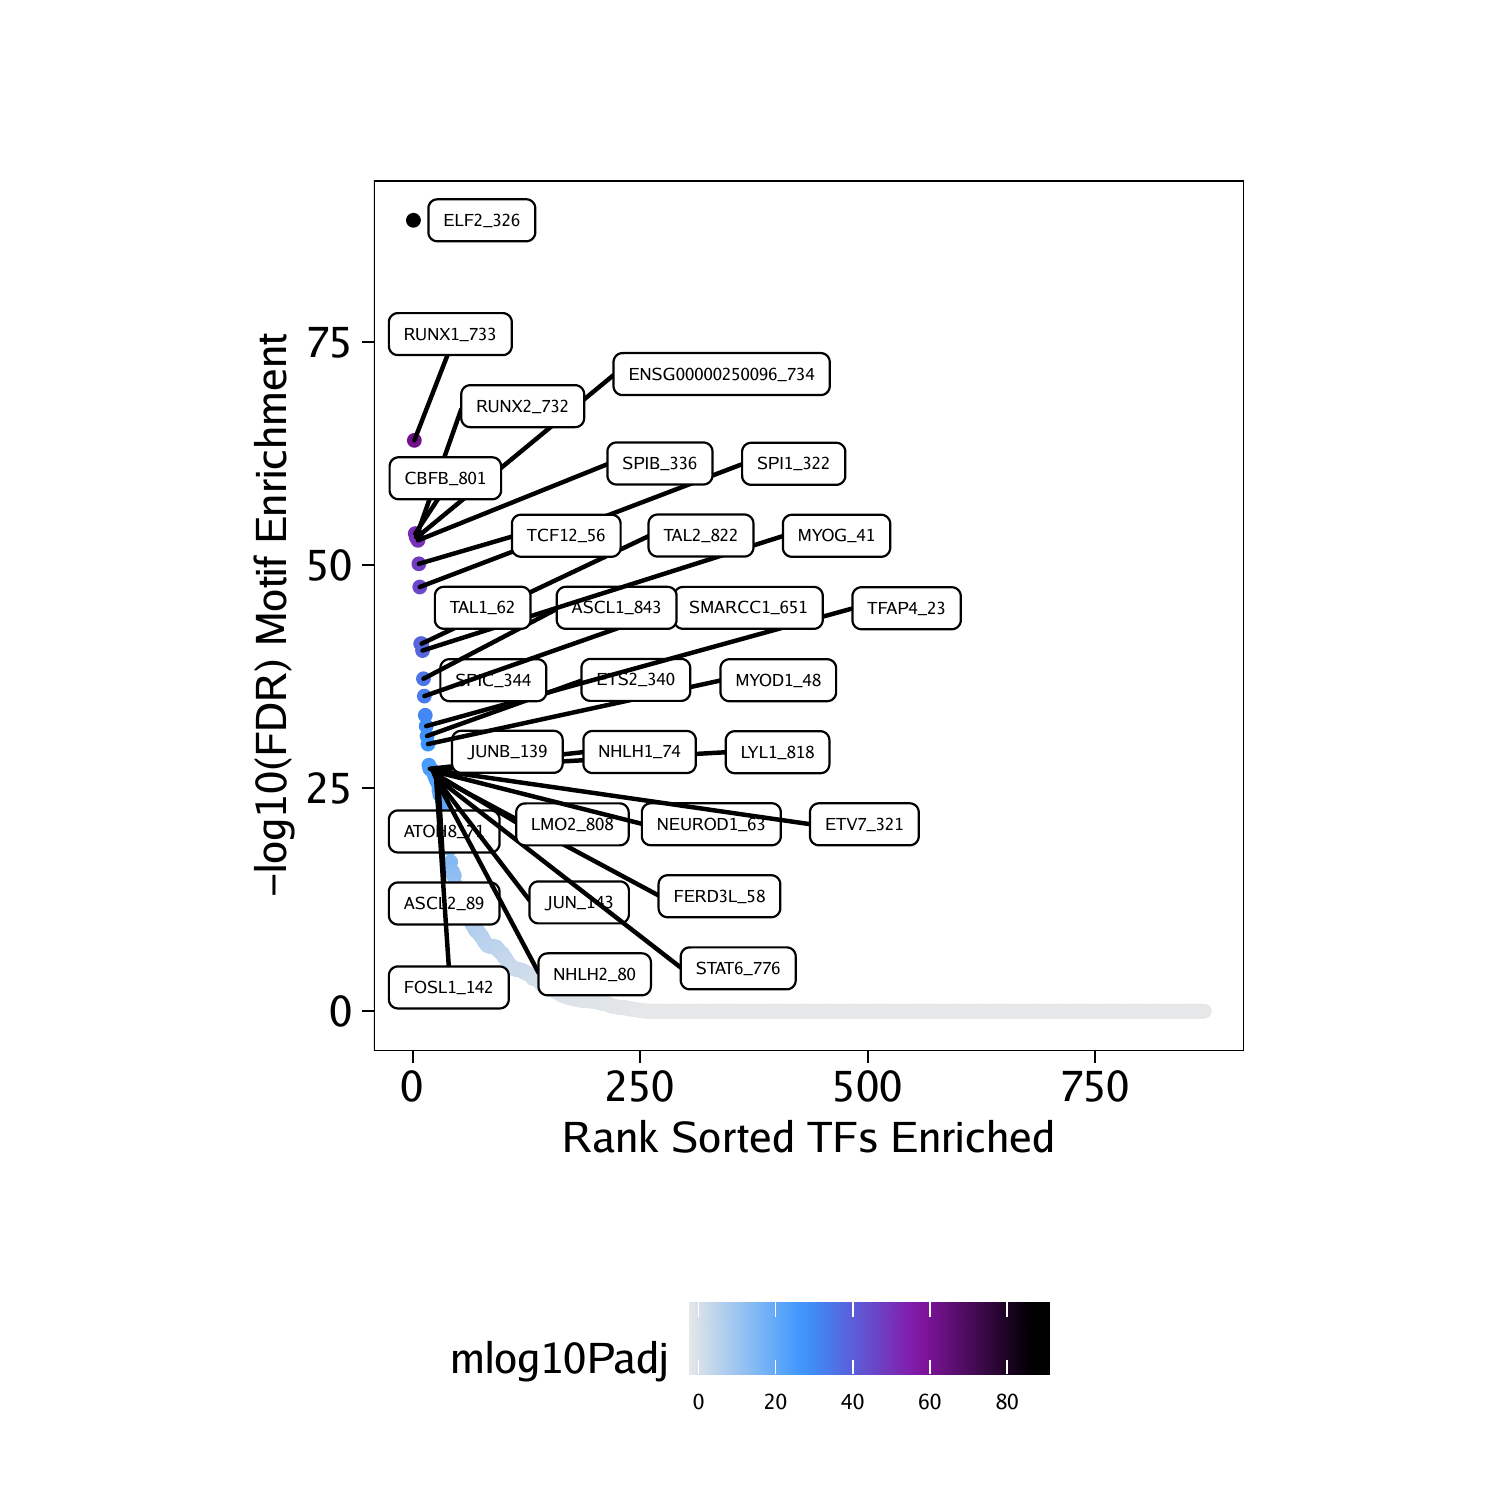
转录因子结合位点 分析

定制富集分析custom

单细胞水平的富集分析
chromVAR is designed for predicting enrichment of TF activity on a per-cell basis from sparse chromatin accessibility data. The two primary outputs of chromVAR are:
- “deviations” - A deviation is a bias-corrected measurement of how far the per-cell accessibility of a given feature (i.e motif) deviates from the expected accessibility based on the average of all cells or samples.
- “z-score” - The z-score, also known as a “deviation score” is the z-score for each bias-corrected deviation across all cells. The absolute value of the deviation score is correlated with the per-cell read depth. This is because, with more reads, you have higher confidence that the difference in per-cell accessibility of the given feature (i.e. motif) from the expectation is greater than would occur by chance.


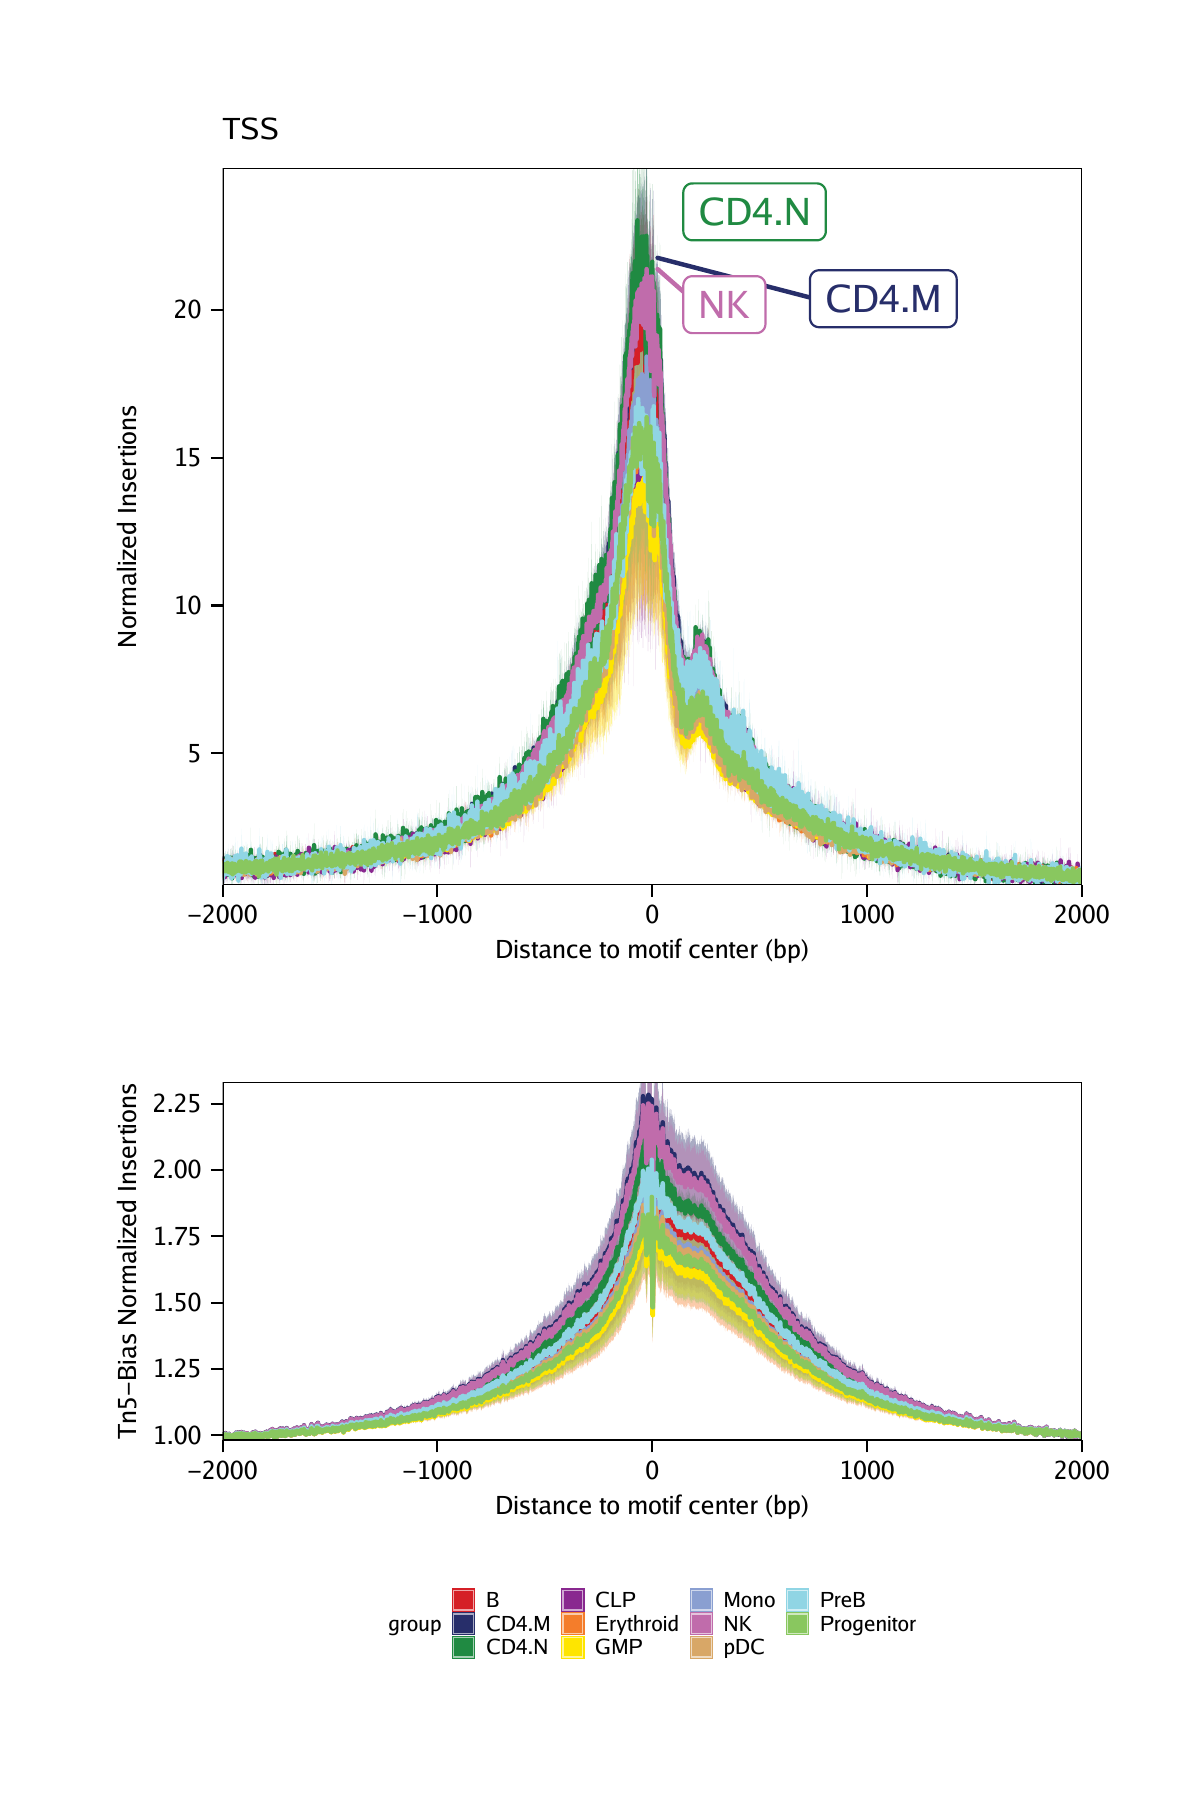
Chapter 14 Footprinting with ArchR | ArchR: Robust and scaleable analysis of single-cell chromatin accessibility data. 找到具体的 结合位点 足迹分析
Transcription factor (TF) footprinting allows for the prediction of the precise binding location of a TF at a particular locus. This is because the DNA bases that are directly bound by the TF are actually protected from transposition while the DNA bases immediately adjacent to TF binding are accessible.

Ideally, TF footprinting is performed at a single site to determine the precise binding location of the TF. However, in practice, this requires very high sequencing depth, often much higher depth than what most users would obtain from either bulk or single-cell ATAC-seq. To get around this problem, we can combine Tn5 insertion locations across many instances of predicted TF binding. For example, we can take all peaks that harbor a CTCF motif and make an aggregate TF footprint for CTCF across the whole genome.
motif 足迹分析
To calculate the insertion bias for a pseudo-bulk footprint, ArchR creates a k-mer frequency matrix that is represented as all possible k-mers across a window +/- N bp (user-defined, default 250 bp) from the motif center. Then, iterating over each motif site, ArchR fills in the positioned k-mers into the k-mer frequency matrix. This is then calculated for each motif position genome-wide. Using the sample’s k-mer frequency table, ArchR can then compute the expected Tn5 insertions by multiplying the k-mer position frequency table by the observed/expected Tn5 k-mer frequency.
plotFootprints(
  seFoot = seFoot,
  ArchRProj = projHeme5,
  normMethod = "Subtract",
  plotName = "Footprints-Subtract-Bias",
  addDOC = FALSE,
  smoothWindow = 5
)
感觉就footprinting可以理解为特征 就像每个人的脚趾头一样 都是独一无二的 所以叫做footprinting 就像沙滩上留下的footprinting都是非常特征性的
本质上任何一个meta infomation都可以
plotFootprints(
  seFoot = seTSS,
  ArchRProj = projHeme5,
  normMethod = "None",
  plotName = "TSS-No-Normalization",
  addDOC = FALSE,
  flank = 2000,
  flankNorm = 100
)
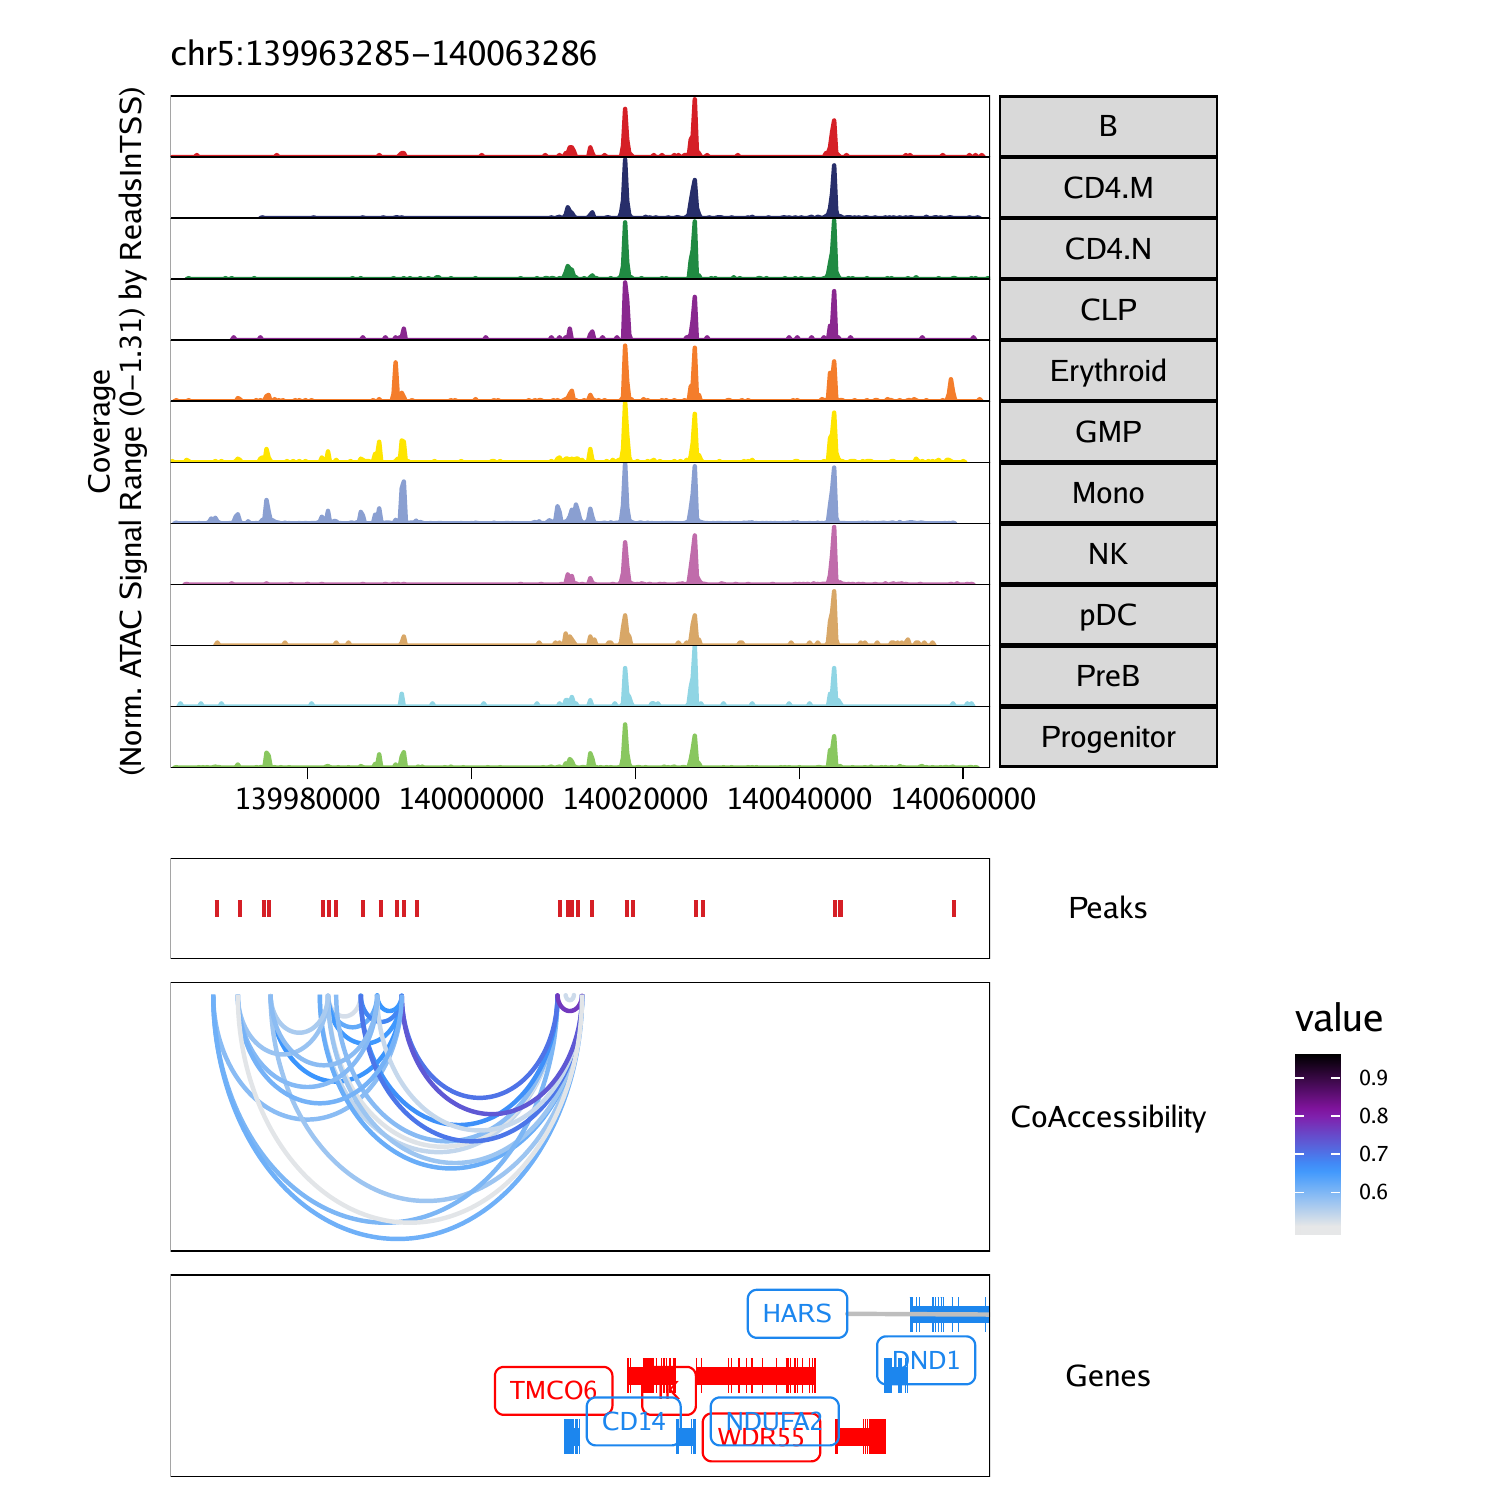
Co-accessibility is a correlation in accessibility between two peaks across many single cells. Said another way, when Peak A is accessible in a single cell, Peak B is often also accessible. We illustrate this concept visually below, showing that Enhancer E3 is often co-accessible with Promoter P.

One thing to note about co-accessibility analysis is that it often identified cell type-specific peaks as being co-accessibile. This is because these peaks are often all accessible together within a single cell type and often all not accessible in all other cell types. This drives a strong correlation but does not necessarily mean that there is a regulatory relationship between these peaks.
projHeme5 <- addCoAccessibility(
    ArchRProj = projHeme5,
    reducedDims = "IterativeLSI"
)
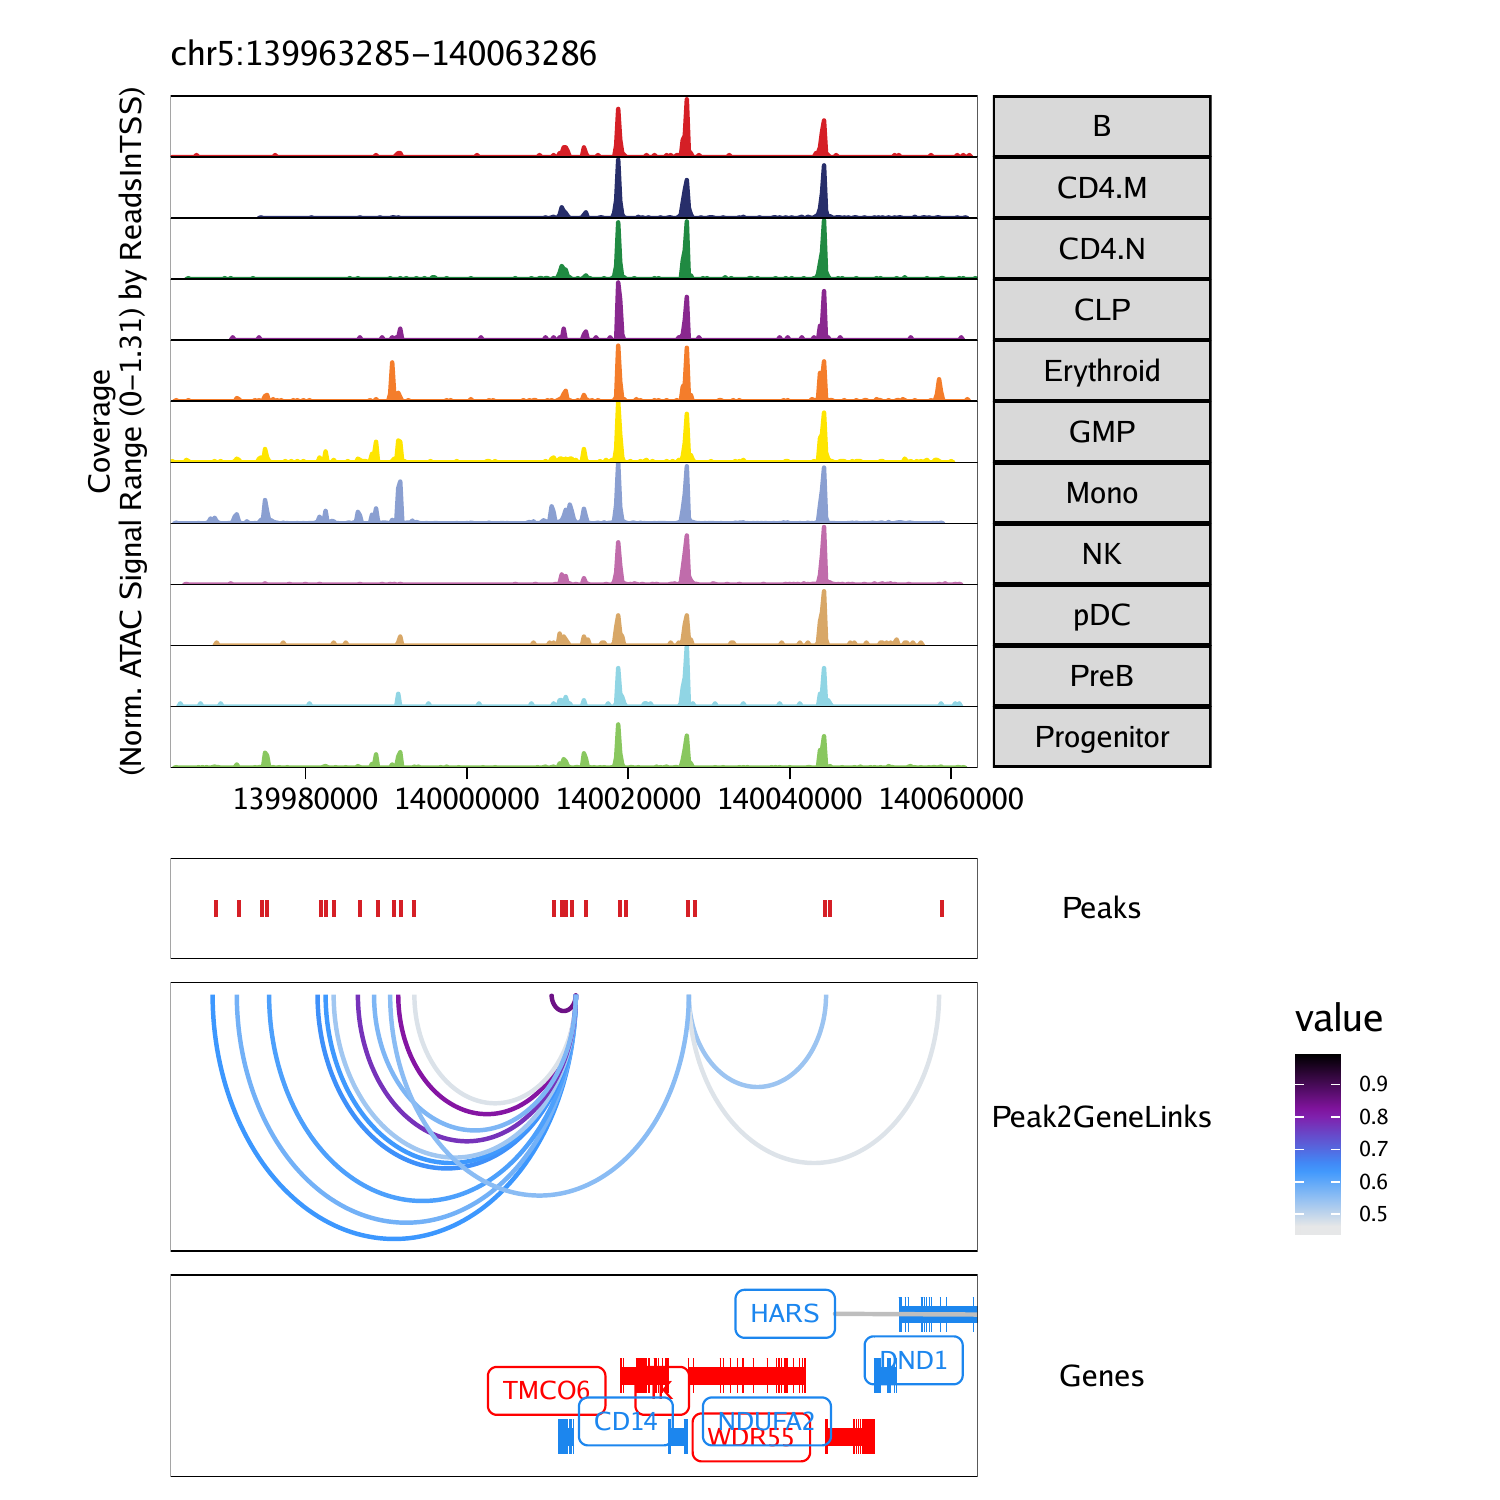
peaktogene 与
Similar to co-accessibility, ArchR can also identify so-called “peak-to-gene links”. The primary differences between peak-to-gene links and co-accessibility is that co-accessibility is an ATAC-seq-only analysis that looks for correlations in accessibility between two peaks while peak-to-gene linkage leverages integrated scRNA-seq data to look for correlations between peak accessibility and gene expression. These represent orthogonal approaches to a similar problem. However, because peak-to-gene linkage correlates scATAC-seq and scRNA-seq data, we often think of these links as more relevant to gene regulatory interaction
projHeme5 <- addPeak2GeneLinks(
    ArchRProj = projHeme5,
    reducedDims = "IterativeLSI"
)
p <- plotBrowserTrack(
ArchRProj = projHeme5,
groupBy = "Clusters2",
geneSymbol = markerGenes,
upstream = 50000,
downstream = 50000,
loops = getPeak2GeneLinks(projHeme5)
)
This motif similarity makes it challenging to identify the specific TFs that might be driving observed changes in chromatin accessibility at their predicted binding sites. To circumvent this challenge, we have previously ATAC-seq and RNA-seq to identify TFs whose gene expression is positively correlated to changes in the accessibility of their corresponding motif. We term these TFs “positive regulators”. However, this analysis relies on matched gene expression data which may not be readily available in all experiments. To overcome this dependency, ArchR can identify TFs whose inferred gene scores are correlated to their chromVAR TF deviation z-scores. To achieve this, ArchR correlates chromVAR deviation z-scores of TF motifs with gene activity scores of TF genes from the low-overlapping cell aggregates. When using scRNA-seq integration with ArchR, gene expression of the TF can be used instead of inferred gene activity score.
To identify TFs whose motif accessibility is correlated with with their own gene activity (either by gene score or gene expression), we use the correlateMatrices() function and provide the two matrices that we are interested in, in this case the GeneScoreMatrix and the MotifMatrix.


相关文章
- springboot启动流程概述_简述app启动的主要流程
- 第五章·自动化运维工具-Ansible流程控制
- 冷链行业市场规模趋势:数字化供应链协同流程商业化、信息化
- LCD1602温度显示程序设计流程「建议收藏」
- activity 工作流程引擎-如何画流程图
- 微信小程序后端开发流程_微信小程序开发入门
- Camunda流程引擎快速入门——Hello World示例
- React源码中的计算流程和优先级
- React源码学习入门(十二)DOM组件更新流程与Diff算法
- App Store上架iOS App的详细流程
- Sentieon BWA-Meth流程:甲基化WGBS数据分析速度与精确性的完美结合
- 量化交易机器人开发功能和流程
- 新手使用阿里云ECS服务器入门使用流程
- 关于SQL存储过程入门基础(流程控制)