
【python】采集可爱猫咪数据并作可视化
2023-09-14 09:05:36 时间
前言
嗨喽~大家好呀,这里是魔王呐 !

环境介绍:
-
python 3.6
-
pycharm
爬虫部分使用模块:
-
csv
-
requests >>> pip install requests
-
parsel
如何安装python第三方模块:
- win + R 输入 cmd 点击确定, 输入安装命令 pip install 模块名 (pip install requests) 回车
- 在pycharm中点击Terminal(终端) 输入安装命令

数据可视化使用模块:
-
pyecharts
-
pandas
本节课程的案例流程思路:
一. 网站数据来源查询:
-
确定一下目标需求: 爬取猫咪交易网站数据 做一个数据可视化图
-
去网站 : 地区 …
-
如果想要在网页上抓包 找一些数据来源 都是要通过开发者工具 F12/ 鼠标右键点击检查
- 可以直接复制想要数据内容在开发者工具进行搜索

二. 代码实现步骤
-
请求 http://www.maomijiaoyi.com/index.php?/chanpinliebiao_c_2.html 获取 猫咪的详情页url地址以及地区
-
请求 猫咪的详情页url地址 获取猫咪详情信息数据
-
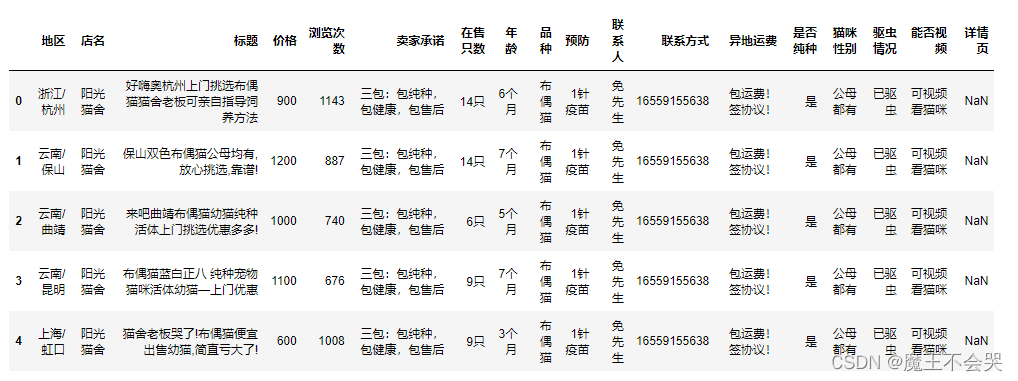
保存数据 到CSV文件
-
数据可视化

采集代码
获取源码链接点击
import requests  # 第三方模块 需要 pip install requests 发送请求
import parsel # 解析模块 pip install parsel
import csv # 内置模块 不需要大家安装
f = open('猫咪.csv', mode='a', encoding='utf-8', newline='')
csv_writer = csv.DictWriter(f, fieldnames=['地区', '店名', '标题', '价格', '浏览次数', '卖家承诺', '在售只数',
                                           '年龄', '品种', '预防', '联系人', '联系方式', '异地运费', '是否纯种',
                                           '猫咪性别', '驱虫情况', '能否视频', '详情页'])

# 写入表头
csv_writer.writeheader()
for page in range(1, 21):
    print(f'===========================正在爬取第{page}页的数据内容==================================')

请求头: 把python代码伪装成 浏览器对服务器发送请求
headers = {
    'User-Agent': 'Mozilla/5.0 (Windows NT 10.0; Win64; x64) AppleWebKit/537.36 (KHTML, like Gecko) Chrome/89.0.4389.114 Safari/537.36'
}
response = requests.get(url=url, headers=headers)
获取网页的文本数据 response.text json() 获取json字典数据
# print(response.text)
# 解析数据 获取 猫咪的详情页url地址以及地区
# 要把 网页文本数据转换成 parsel 解析的 对象
selector = parsel.Selector(response.text)
href = selector.css('div.content:nth-child(1) a::attr(href)').getall()
areas = selector.css('div.content:nth-child(1) .area .color_333::text').getall()
# 列表推导式
areas = [i.strip() for i in areas]
# 需要把两个列表合成一个列表 遍历循环提取每一个元素
zip_data = zip(href, areas)
for index in zip_data:
css选择器: 根据标签提取数据内容
getall() 返回的是列表
get() 是返回的字符串

        response_1 = requests.get(url=index_url, headers=headers)
        selector_1 = parsel.Selector(response_1.text)
        area = index[1]
        # get() 取一个  返回是字符串  strip() 字符串的方法
        title = selector_1.css('.detail_text .title::text').get().strip() # 标题
        shop = selector_1.css('.dinming::text').get().strip() # 店名
        price = selector_1.css('.info1 div:nth-child(1) span.red.size_24::text').get() # 价格
        views = selector_1.css('.info1 div:nth-child(1) span:nth-child(4)::text').get() # 浏览次数
        # replace() 替换
        promise = selector_1.css('.info1 div:nth-child(2) span::text').get().replace('卖家承诺: ', '') # 浏览次数
        num = selector_1.css('.info2 div:nth-child(1) div.red::text').get() # 在售只数
        age = selector_1.css('.info2 div:nth-child(2) div.red::text').get() # 年龄
        kind = selector_1.css('.info2 div:nth-child(3) div.red::text').get() # 品种
        prevention = selector_1.css('.info2 div:nth-child(4) div.red::text').get() # 预防
        person = selector_1.css('div.detail_text .user_info div:nth-child(1) .c333::text').get() # 联系人
        phone = selector_1.css('div.detail_text .user_info div:nth-child(2) .c333::text').get() # 联系方式
        postage = selector_1.css('div.detail_text .user_info div:nth-child(3) .c333::text').get().strip() # 包邮
        purebred = selector_1.css('.xinxi_neirong div:nth-child(1) .item_neirong div:nth-child(1) .c333::text').get().strip() # 是否纯种
        sex = selector_1.css('.xinxi_neirong div:nth-child(1) .item_neirong div:nth-child(4) .c333::text').get().strip() # 猫咪性别
        video = selector_1.css('.xinxi_neirong div:nth-child(2) .item_neirong div:nth-child(4) .c333::text').get().strip() # 能否视频
        worming = selector_1.css('.xinxi_neirong div:nth-child(2) .item_neirong div:nth-child(2) .c333::text').get().strip() # 是否驱虫
        dit = {
            '地区': area,
            '店名': shop,
            '标题': title,
            '价格': price,
            '浏览次数': views,
            '卖家承诺': promise,
            '在售只数': num,
            '年龄': age,
            '品种': kind,
            '预防': prevention,
            '联系人': person,
            '联系方式': phone,
            '异地运费': postage,
            '是否纯种': purebred,
            '猫咪性别': sex,
            '驱虫情况': worming,
            '能否视频': video,
        }
        csv_writer.writerow(dit)
        print(title, area, shop, price, views, promise, num, age,
              kind, prevention, person, phone, postage, purebred, sex, video, worming, index_url, sep=' | ')

可视化代码
获取源码链接点击
import pandas as pd
pd.set_option('display.max_columns', None)
cat_info = pd.read_csv(r'C:\Users\青灯教育\Desktop\猫咪.csv', encoding='utf-8', engine='python')
cat_info.head(5)
cat_info['地区'] = cat_info['地区'].astype(str)
cat_info['province'] = cat_info['地区'].map(lambda s: s.split('/')[0])
pv = cat_info['province'].value_counts().reset_index()
from pyecharts import options as opts
from pyecharts.charts import Map
from pyecharts.faker import Faker

c = (
    Map(init_opts=opts.InitOpts(theme=ThemeType.LIGHT))
    .add("", [list(z) for z in zip(list(pv['index']), list(pv['province']))], "china")
    .set_global_opts(
        title_opts=opts.TitleOpts(title="猫猫售卖省份分布"),
        visualmap_opts=opts.VisualMapOpts(max_=16500, is_piecewise=True),
    )
)

c.render_notebook()

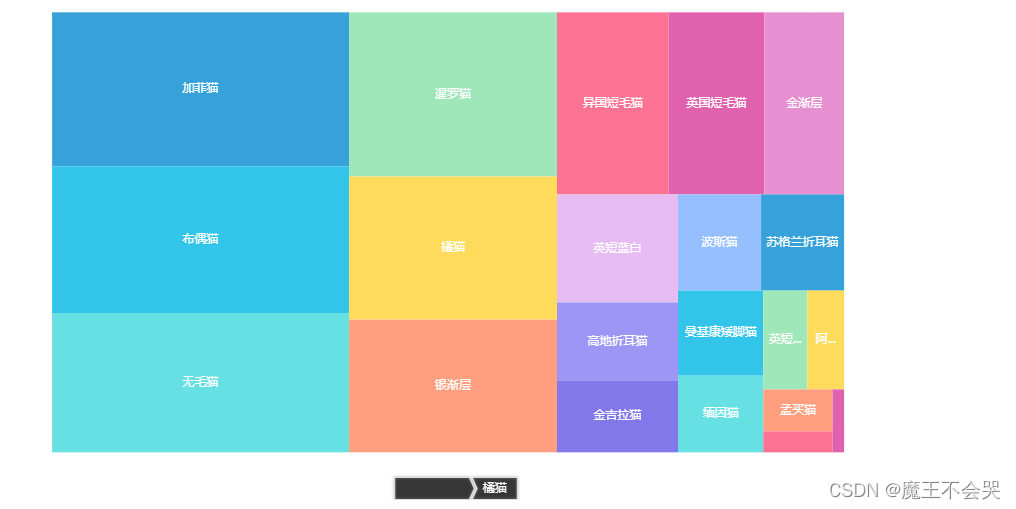
# 交易品种占比树状图
from pyecharts import options as opts
from pyecharts.charts import TreeMap

pingzhong = cat_info['品种'].value_counts().reset_index()
data = [{'value':i[1],'name':i[0]} for i in zip(list(pingzhong['index']),list(pingzhong['品种']))]

c = (
    TreeMap(init_opts=opts.InitOpts(theme=ThemeType.LIGHT))
    .add("", data)
    .set_global_opts(title_opts=opts.TitleOpts(title=""))
    .set_series_opts(label_opts=opts.LabelOpts(position="inside"))
)

c.render_notebook()
#
price = cat_info.groupby('品种').mean()['价格'].reset_index()
price['价格'] = round(price['价格'],0)
price = price.sort_values(by='价格')
from pyecharts import options as opts
from pyecharts.charts import PictorialBar
from pyecharts.globals import SymbolType

location = list(price['品种'])
values = list(price['价格'])

c = (
    PictorialBar(init_opts=opts.InitOpts(theme=ThemeType.LIGHT))
    .add_xaxis(location)
    .add_yaxis(
        "",
        values,
        label_opts=opts.LabelOpts(is_show=False),
        symbol_size=18,
        symbol_repeat="fixed",
        symbol_offset=[0, 0],
        is_symbol_clip=True,
        symbol=SymbolType.ROUND_RECT,
    )
    .reversal_axis()
    .set_global_opts(
        title_opts=opts.TitleOpts(title="均价排名"),
        xaxis_opts=opts.AxisOpts(is_show=False),
        yaxis_opts=opts.AxisOpts(
            axistick_opts=opts.AxisTickOpts(is_show=False),
            axisline_opts=opts.AxisLineOpts(
                linestyle_opts=opts.LineStyleOpts(opacity=0),

            ),
        ),
    )
    .set_series_opts(
        label_opts=opts.LabelOpts(position='insideRight')
    )
)

c.render_notebook()

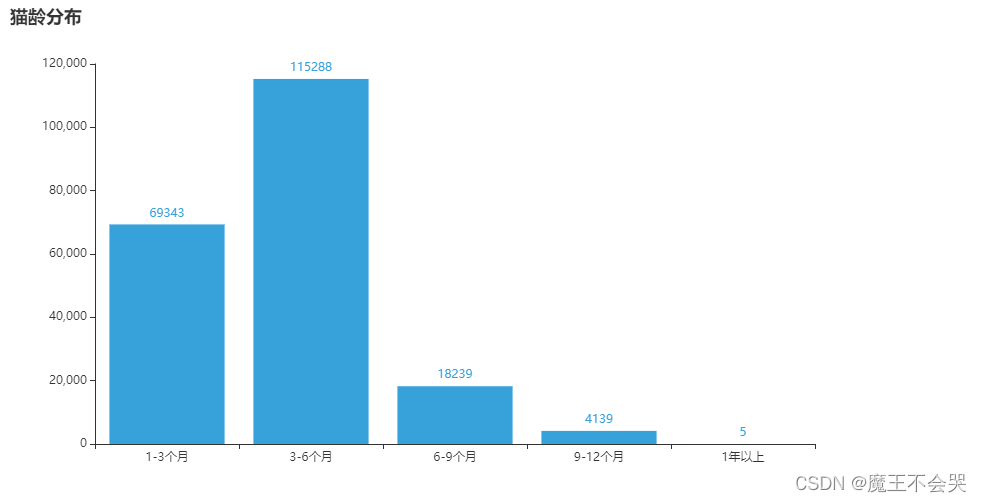
# 年龄分布,柱状图
cat_info['年龄'] = cat_info['年龄'].astype(str)
age = cat_info['年龄'].map(lambda x: x.replace('个月','')).reset_index()
def ages(s):
if s == 'nan':
return s
s = int(s)
if 1 <= s < 3:
return '1-3个月'
if 3 <= s < 6:
return '3-6个月'
if 6 <= s < 9:
return '6-9个月'
if 9 <= s < 12 :
return '9-12个月'
if s >= 12:
return '1年以上'
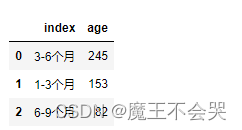
age['age'] = age['年龄'].map(ages)
age = age['age'].value_counts().reset_index()
age = age[age['index'] != 'nan']
age
from pyecharts import options as opts
from pyecharts.charts import Bar
from pyecharts.faker import Faker

x = ['1-3个月','3-6个月','6-9个月','9-12个月','1年以上']
y = [69343,115288,18239,4139,5]

c = (
    Bar(init_opts=opts.InitOpts(theme=ThemeType.LIGHT))
    .add_xaxis(x)
    .add_yaxis('', y)
    .set_global_opts(title_opts=opts.TitleOpts(title="猫龄分布"))
)

c.render_notebook()
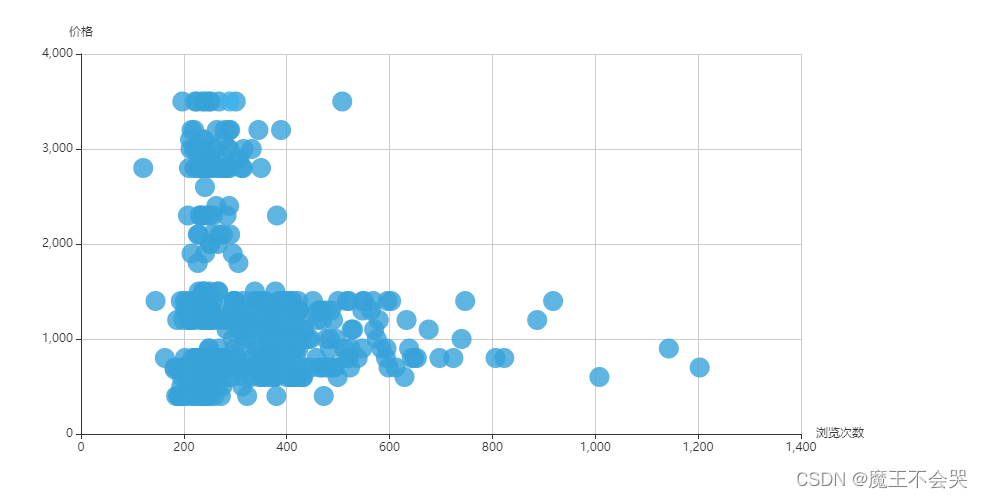
## 浏览次数是否跟价格成正比,散点图
view = cat_info['浏览次数']
money = cat_info['价格']

import pyecharts.options as opts
from pyecharts.charts import Scatter


x_data = list(view)[:1000]
y_data = list(money)[:1000]

c = (
    Scatter(init_opts=opts.InitOpts(theme=ThemeType.LIGHT))
    .add_xaxis(xaxis_data=x_data)
    .add_yaxis(
        series_name="",
        y_axis=y_data,
        symbol_size=20,
        label_opts=opts.LabelOpts(is_show=False),
    )
    .set_series_opts()
    .set_global_opts(
        xaxis_opts=opts.AxisOpts(
            type_="value",
            splitline_opts=opts.SplitLineOpts(is_show=True),
            name='浏览次数'
        ),
        yaxis_opts=opts.AxisOpts(
            type_="value",
            axistick_opts=opts.AxisTickOpts(is_show=True),
            splitline_opts=opts.SplitLineOpts(is_show=True),
            name='价格'
        ),
        tooltip_opts=opts.TooltipOpts(is_show=False),
    )
)

c.render_notebook()
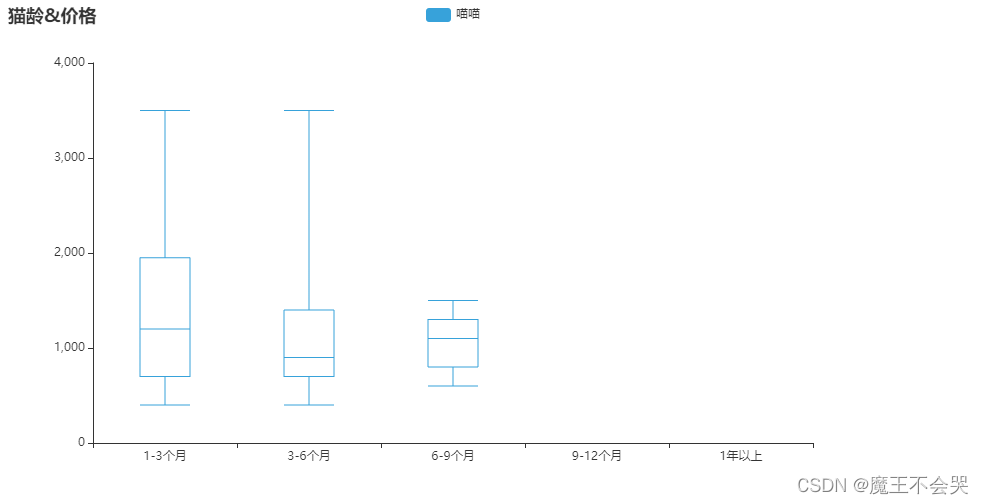
# 价格是否与年龄有关,箱型图
a_p = cat_info[['价格','年龄']]
a_p['年龄'] = a_p['年龄'].map(lambda x: x.replace('个月',''))
def ages(s):
    if s == 'nan':
        return s
    s = int(s)
    if 1 <= s < 3:
        return '1-3个月'
    if 3 <= s < 6:
        return '3-6个月'
    if 6 <= s < 9:
        return '6-9个月'
    if 9 <= s < 12 :
        return '9-12个月'
    if s >= 12:
        return '1年以上'
a_p['age'] = a_p['年龄'].map(ages)
a_p.head()

from pyecharts import options as opts
from pyecharts.charts import Boxplot

v1 = [
    list(a_p[a_p['age'] == '1-3个月']['价格']),
    list(a_p[a_p['age'] == '3-6个月']['价格']),
    list(a_p[a_p['age'] == '6-9个月']['价格']),
    list(a_p[a_p['age'] == '9-12个月']['价格']),
    list(a_p[a_p['age'] == '1年以上']['价格'])
]

c = Boxplot(init_opts=opts.InitOpts(theme=ThemeType.LIGHT))
c.add_xaxis(["1-3个月", "3-6个月",'6-9个月','9-12个月','1年以上'])
c.add_yaxis("喵喵", c.prepare_data(v1))
c.set_global_opts(title_opts=opts.TitleOpts(title="猫龄&价格"))

c.render_notebook()

尾语
没有太晚的开始,不如就从今天行动。
总有一天,那个一点一点可见的未来,
会在你心里,也在你的脚下慢慢清透。
生活,从不亏待每一个努力向上的人。
—— 心灵鸡汤
本文章到这里就结束啦~感兴趣的小伙伴可以复制代码去试试哦 😝

相关文章
- mac 安装python 环境
- python使用requests通过代理地址发送multipart/form-data报文数据
- AI之DS/CV/NLP:Python与人工智能相关的库/框架(机器学习常用库、数据科学常用库、深度学习常用库、计算机视觉常用库、自然语言处理常用库)的简介、案例应用之详细攻略
- Python:利用python编程将上海十六区,2020年5月份房价实时地图(数据来源房天下)进行柱状图、热图可视化
- Python之pandas:将dataframe数据写入到xls表格的多个sheet内(防止写入数据循环覆盖sheet表)
- Python实战——全球疫情数据采集, 并做可视化
- 【Python实战】全球疫情数据采集, 并做可视化展示
- Python采集猫咪数据并做数据可视化图
- python带你采集汽车数据,以后买车就有参考了~
- Python采集招聘数据信息(+详情页)并实现可视化
- python数据分析小案例:把招聘数据做可视化处理~
- 你工作了嘛,没有的话,和我一起用Python采集招聘数据信息(+详情页)并实现可视化
- 外卖必不可少,咋确定好不好吃呢~ python采集数据信息
- python爬虫案例:采集股票数据并制作可视化柱图~
- 使用python采集某二手房源数据并做数据可视化展示(含完整源代码)
- Python教你爬取某团烤肉店铺数据信息并实现数据可视化,吃货还是更多的(内含完整代码)
- 当当~Python采集商品数据信息并作可视化效果
- 想看看一个影片评论怎么样?python带你采集数据做词云
- Python抓取电商平台数据 / 采集商品评论 / 可视化展示 词云图...
- Python疫情数据采集, 并做可视化展示
- Python 获取旅游景点信息及评论并作词云、数据可视化
- 真香,Python “手绘风格”数据可视化方法汇总
- 图形美不胜收,25 个可视化案例,Matplotlib 始终都是数据可视化绕不开的 Python 库
- 太香了!只需一行代码就可以在Python中创建数据可视化!
- 【项目实战】Python实现基于LDA主题模型进行电商产品评论数据情感分析
- python数据可视化示例柱状图
- Python使用技巧(十六):固定时间输出模拟数据
- opencv2 python 读取摄像头数据 修改视屏尺寸
- python 批量打开数据
- python web py入门(5)-把网页的数据写到数据库
- python采集财经数据信息并作可视化~