
yFiles for HTML 2.4.0
Web platform
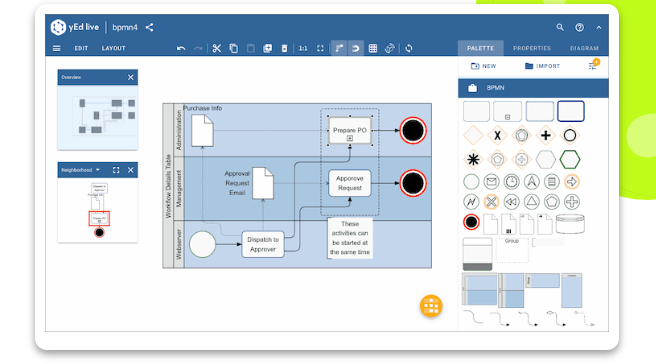
Diagramming in the browser
yFiles for HTML is an extensive JavaScript/HTML5 library that adds diagramming functionality to your HTML5/JavaScript project. It lets you create new custom apps while integrating well with your existing solutions and dashboards on the web.

Technical features
Developer-friendly
Extensive Developer’s Guide and API documentation, runtime type-checking, debugging tools, plus code completion and quick API lookup in many IDEs.

Pure JavaScript
A pure JavaScript solution that works seamlessly with Angular, React, Vue.js, and basically any other JavaScript framework.
100% client-side
100% client-side graph drawing and graph editing — no server component or browser plugin required.

TypeScript and GWT support
The complete set of type definitions is available for TypeScript and GWT.
Runs everywhere
Supports all modern browsers on desktops, phones, and tablets - even down to Internet Explorer 9 - if you must! At runtime, the minimum requirement is only ECMAScript 5.
Develop with modern ECMAScript
The API supports newer ECMAScript features like async functions, promises, classes, JS modules, iterators, etc. during development.
Latest rendering technologies
Leverages SVG, WebGL, and HTML 5 Canvas to draw diagrams — exclusively, simultaneously, or switched dynamically. It's your choice. Spice up your styling with CSS, animations, and transitions.

Flexible Deployment
Develop with your favorite toolchain! Use webpack, ES modules, UMD, AMD, Angular CLI, loading as Node.js module, plain script loading, and more
是什么让 yWorks 与众不同?
经验
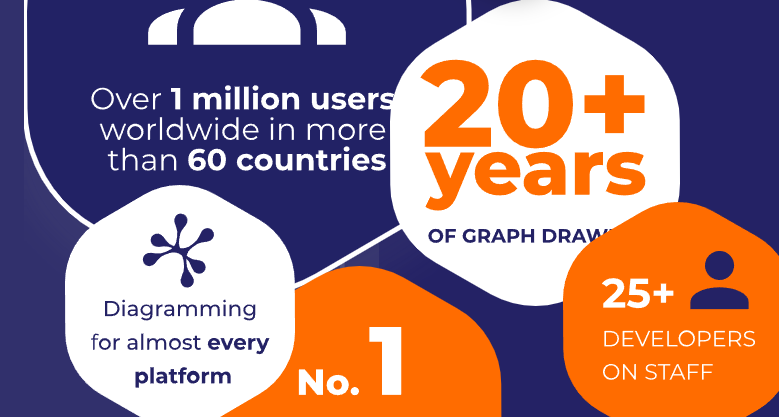
yWorks 提供数据可视化解决方案已有 20 多年的历史。基于我们的大学背景,我们结合了最新的科学发现、当前的技术标准和深厚的软件开发专业知识——将图形可视化的未来变为现实。我们的目标是为您能想到的每个用例提供最佳建议和支持。”
信心
yWorks在 60 多个国家拥有超过100 万用户和客户,受到全球许多不同类型公司的信任。我们的客户重视我们的经验并欣赏我们的热情。此外,我们的图形绘制算法是首屈一指的。
卓越
我们为几乎所有技术和平台提供解决方案。每个客户都受益于我们的核心开发人员和数据可视化专家提供的直接支持。我们很自豪能够提供行业领先的用于可视化、编辑和分析图形的软件库。

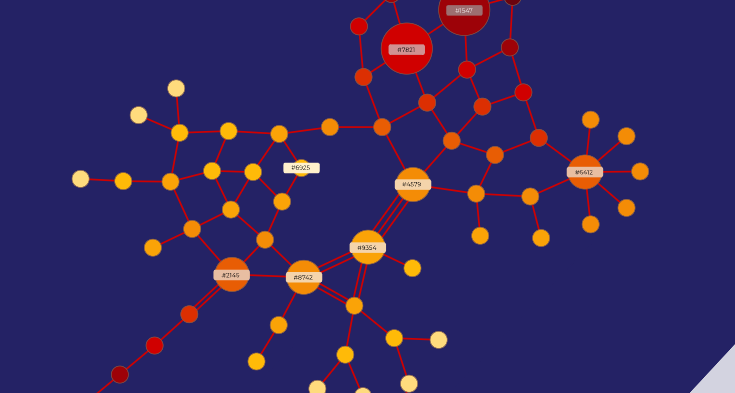
为什么要 可视化数据?
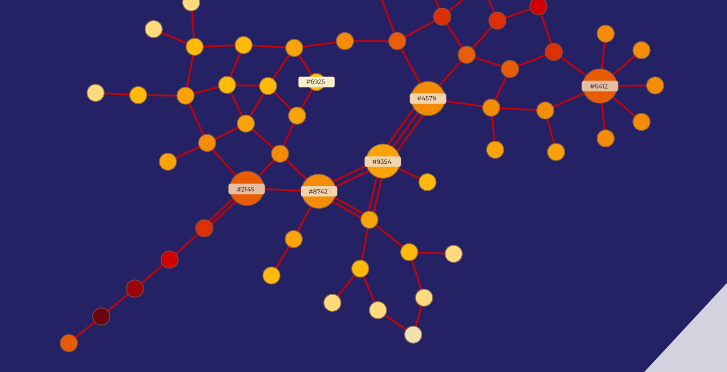
图形可视化是分析复杂信息和做出数据驱动决策的关键要素。它们使您可以轻松识别和理解关系、模式和异常值。在当今的大数据世界中,这比以往任何时候都更加重要。
清晰简单
人是很视觉化的。将数据视为图表有助于您更快地吸收信息、直观地探索并更轻松地使用它。可视化可以帮助监控大型网络并改进所有类型的工作流程。

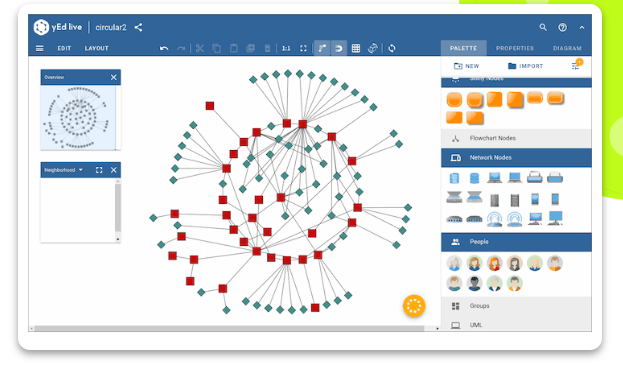
可调节的
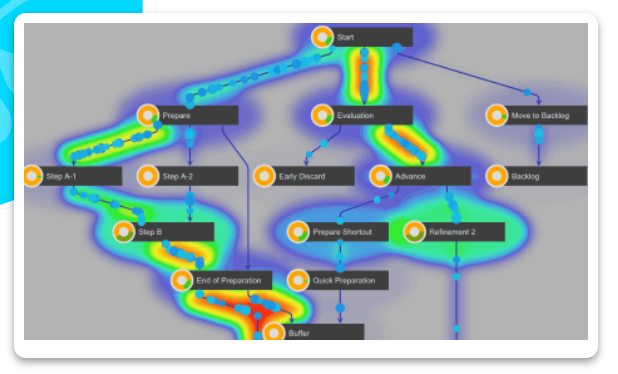
多种观点拓宽视野。只需单击一下即可更改您的观点:获取概览或详细探索特定区域。图形可视化让可能性触手可及。
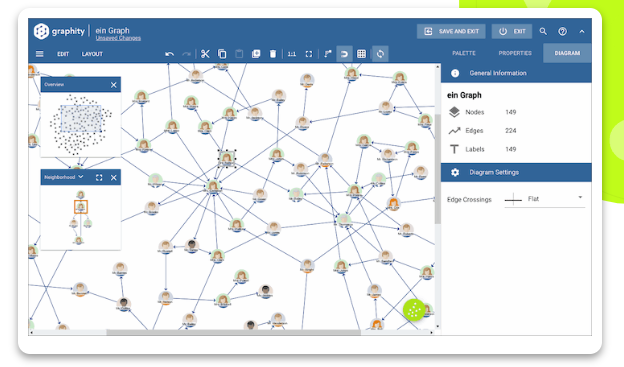
交互的
实时体验数据的直接影响。使用您的数据集并查看更改如何影响图表的某些方面。这可以提供对过去发展和当前事件的宝贵洞察,并改进未来预测。

内容丰富
挖掘人类的才能:模式识别。图形可视化可帮助您一目了然地识别模式和趋势。此外,图形分析算法可用于可视化数据中的关键信息。
相关文章
- HTML+CSS基础课程-imooc-【更新完毕】
- Tomcat和Weblogic部署纯html文件
- html中label及加上属性for之后的用法
- [HTML 5] Inserting DOM element
- [Angular HTML] Overwrite input value, String.fromCharCode & input.selectionStart
- 在js中使用createElement创建HTML对象和元素
- html学习
- [Angular] Dynamic replacement for index.html
- SAP UI5 应用 index.html 里引导 script 属性的解析原理
- SAP Cloud for Customer(C4C) HTML mashup的运行时单步调试
- Html 语法学习笔记三
- 使用Angular的property binding给HTML DOM元素的class动态赋值
- HTML Component Library for Delphi
- ASP.NET Web Forms - HTML 页面
- JavaScript-html标题滚动效果
- python 反扒技巧 爬虫失败的原因分析 html的学习 css java html dom bs4 xpath selenium js混淆加密 反混淆 ajaxs
- HTML基本介绍
- HTML实体
- Zoople HTML 编辑器组件 for NET