
Stimulsoft Reports and Dashboards 2022.4.3
新版只提供JS/WEB---Crack
We are pleased to announce the release of a new version of Stimulsoft Reports and Dashboards 2022.4! In the latest version, we have added 3D charts, GS1 barcodes, the new component - Electronic signature, additional authorization options in our services and applications, optimized the UI of the report designer, and, in general, made your work with data more convenient and efficient.
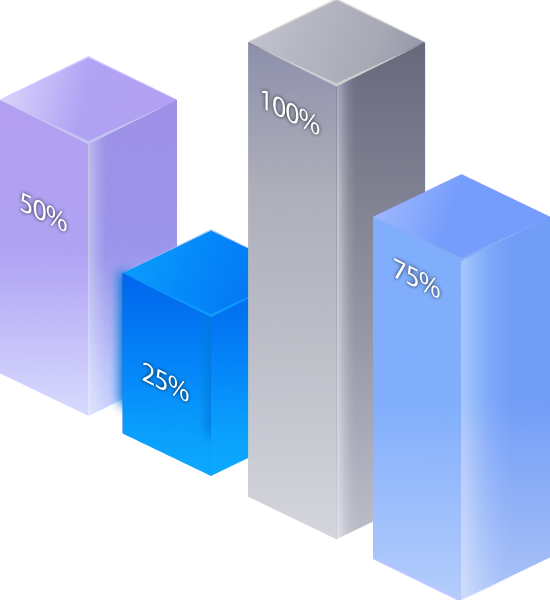
New 3D charts
We have added 3D bar charts for reports and dashboards. Now you can display data as 3D Clustered Column, 3D Stacked Column, and 3D Full-stacked Column. When using 3D charts in reports and dashboards, you can also change the geometry of the series of graphical objects by defining them as Box, Pyramid, and Partial Pyramid. When creating a standard 3D multi-series bar chart, you can also specify the display mode of the graphic objects for the argument - side-by-side or behind. This behavior is determined by the value of the Side-by-Side chart area property. Histograms are presented as separate types in the chart selection menu.

Optimizing JS components
The support of various screen scales has been implemented for the following products: Reports.JS and Reports.PHP, Dashboards.JS and Dashboards.PHP. In addition, the changes affected the transfer of all themes and styles of components from CSS to JS scripts. Now, you don't need to include CSS files when using JS components in a project. All the images that are used in JS products have been converted to the WebP format. Also, we have added a new method - setTheme(themeName) to set a theme of the designer and viewer. Additionally, the theme property has been added to set a theme of a JS component by default.
New GS1 Barcodes
In the new version of our products, we have added several new barcodes – GS1 DataMatrix and GS1 QR Code. The GS1 standard describes the proper usage of data and barcodes in business applications. As a carrier, standard barcodes are used. Using special barcode commands, information is recorded in them in a certain way. New barcodes allow you to record data in a simple and understandable way, and all the necessary commands are added automatically.

MariaDB data source
In this release, we have added a new adapter for getting data from MariaDB Server storage. It is one of the most popular open-source relational databases. Select MariaDB to create a data source on the SQL tab in the New Data Source window. After creating a connection and running a query, you can create reports and dashboards based on retrieved data.

Electronic signature
In release 2022.4.1, we added a new component - Electronic signature. Using this component, you can sign reports graphically - enter, draw, or insert an image of a handwritten signature. You can also add some text, for example, name, initials, company, job title, etc. Moreover, combinations of different ways of signing the report are possible. You can sign a report in design mode or when viewing it.

PDF digital signature
We have added a new component - PDF digital signature. You may use it to add a digital signature to a report using Adobe PDF after converting it into a PDF document.

相关文章
- Easy Games With Python and Pygame(二)- Pygame 绘制图形
- ARM汇编:数据处理指令集:MOV、ADD、ADDS、ADC、SUB、SUBS、SBC、RSB、MUL、AND、ORR、EOR、BIC、CMP、TST、TEQ、LSL、LSR、ASR、RORV
- stimulsoft mysql_Stimulsoft Server
- ORA-32600: RETENTION and PCTVERSION cannot be used together ORACLE 报错 故障修复 远程处理
- ORA-00981: cannot mix table and system auditing options ORACLE 报错 故障修复 远程处理
- MySQL Error number: MY-010530; Symbol: ER_RPL_SLAVE_AUTO_POSITION_IS_1_AND_GTID_MODE_IS_OFF; SQLSTATE: HY000 报错 故障修复 远程处理
- PostgreSQL 25007: schema_and_data_statement_mixing_not_supported 报错 故障修复 远程处理
- and命令Linux系统下Expand命令简介(linux下exp)
- Powering Up Your Data Management with MongoDB and Solr(mongodbsolr)
- Exploring the Power of Linux 2G: A Guide to Maximizing Performance and Efficiency(linux2g)
- Exploring the Benefits and Limitations of Linux Hardware RAID(linux硬raid)
- Mastering Oracle: Tips and Tricks for Efficient Summation(oracle求和)
- Exploring the Power of Linux Fingerprint Authentication: Secure and Efficient Access Control(linuxfp)
- Exploring the Power of Redis Value: How It Can Improve Your Data Storage and Retrieval(redisvalue)
- Oracle中使用除了And的其他查询关键字(oracle中除了and)
- Oracle 数据库中使用AND拼接的威力(oracle中and拼接)