
[Python] Statistical analysis of time series
Global Statistics:
Common seen methods as such
1. Mean
2. Median
3. Standard deviation: the larger the number means it various a lot.
4. Sum.
Rolling Statistics:
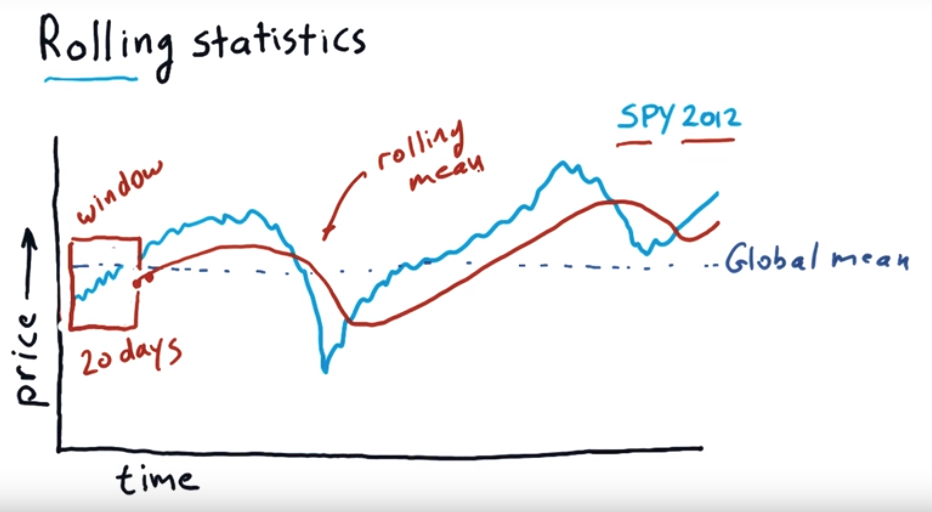
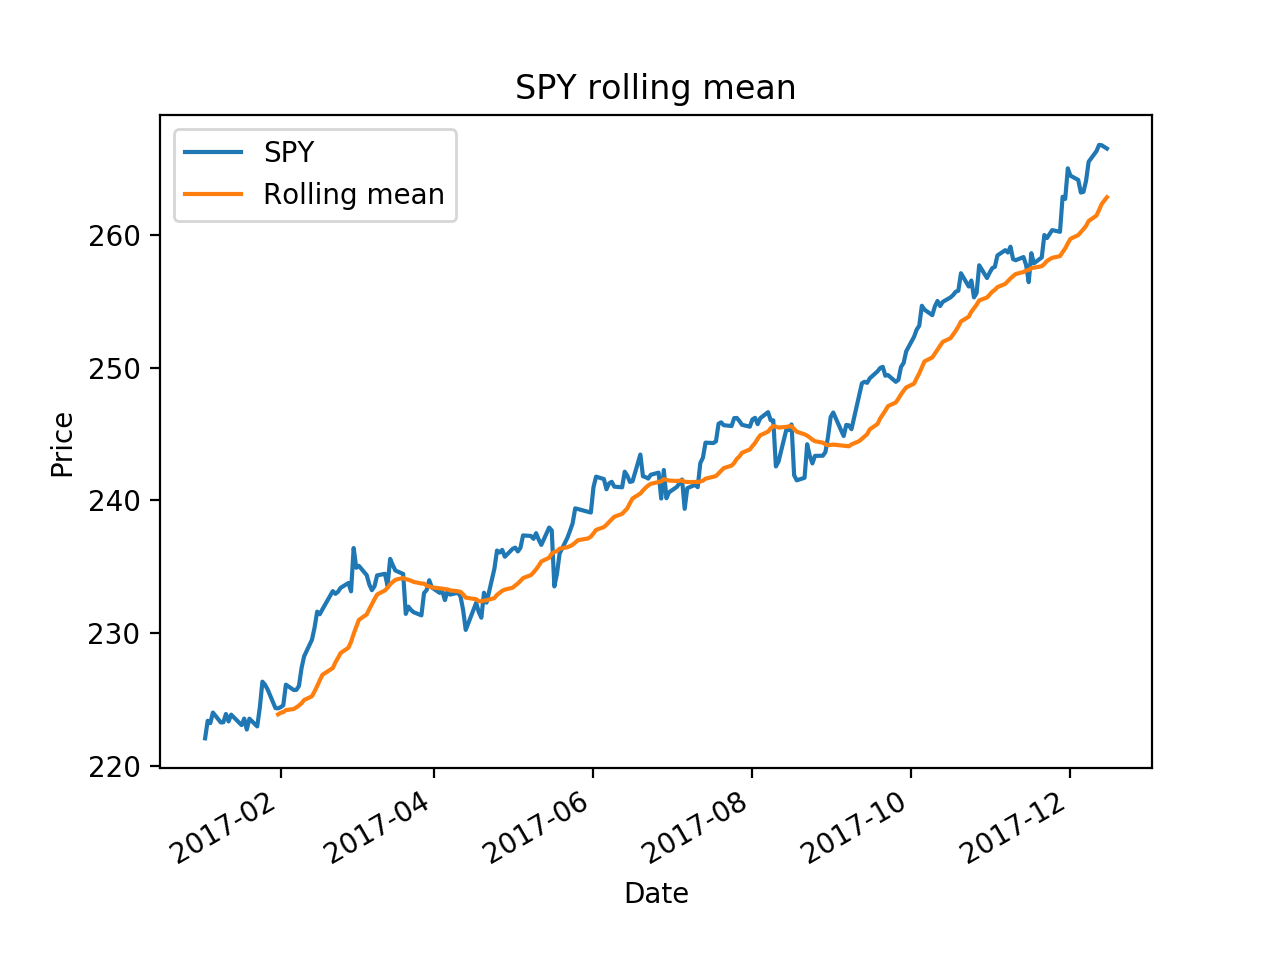
It use a time window, moving forward each day to calculate the mean value of those window periods.
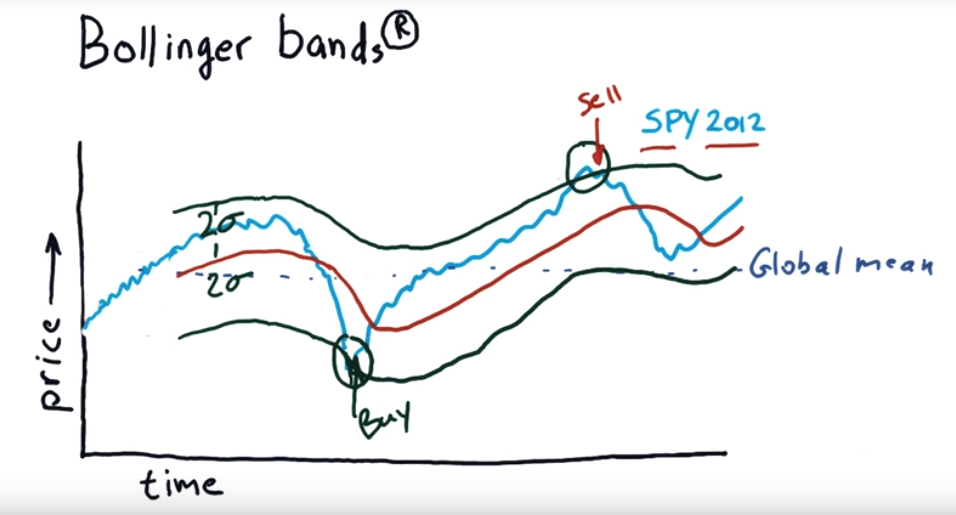
To find which day is good to buy which day is good for sell, we can use Bollinger bands.
Bollinger bands:
import os
import pandas as pd
import matplotlib.pyplot as plt

def test_run():
    start_date='2017-01-01'
    end_data='2017-12-15'
    dates=pd.date_range(start_date, end_data)

    # Create an empty data frame
    df=pd.DataFrame(index=dates)

    symbols=['SPY', 'AAPL', 'IBM', 'GOOG', 'GLD']
    for symbol in symbols:
        temp=getAdjCloseForSymbol(symbol)
        df=df.join(temp, how='inner')

    return df

if __name__ == '__main__':
    df=test_run()
    # data=data.ix['2017-12-01':'2017-12-15', ['IBM', 'GOOG']]
    # df=normalize_data(df)
    ax = df['SPY'].plot(title="SPY rolling mean", label='SPY')
    rm = df['SPY'].rolling(20).mean()
    rm.plot(label='Rolling mean', ax=ax)
    ax.set_xlabel('Date')
    ax.set_ylabel('Price')
    ax.legend(loc="upper left")
    plt.show()
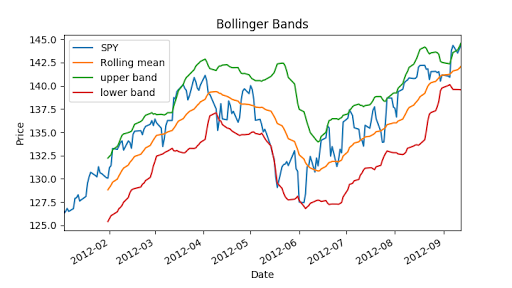
Now we can calculate Bollinger bands, it is 2 times std value.
"""Bollinger Bands."""

import os
import pandas as pd
import matplotlib.pyplot as plt

def symbol_to_path(symbol, base_dir="data"):
    """Return CSV file path given ticker symbol."""
    return os.path.join(base_dir, "{}.csv".format(str(symbol)))


def get_data(symbols, dates):
    """Read stock data (adjusted close) for given symbols from CSV files."""
    df = pd.DataFrame(index=dates)
    if 'SPY' not in symbols:  # add SPY for reference, if absent
        symbols.insert(0, 'SPY')

    for symbol in symbols:
        df_temp = pd.read_csv(symbol_to_path(symbol), index_col='Date',
                parse_dates=True, usecols=['Date', 'Adj Close'], na_values=['nan'])
        df_temp = df_temp.rename(columns={'Adj Close': symbol})
        df = df.join(df_temp)
        if symbol == 'SPY':  # drop dates SPY did not trade
            df = df.dropna(subset=["SPY"])

    return df


def plot_data(df, title="Stock prices"):
    """Plot stock prices with a custom title and meaningful axis labels."""
    ax = df.plot(title=title, fontsize=12)
    ax.set_xlabel("Date")
    ax.set_ylabel("Price")
    plt.show()


def get_rolling_mean(values, window):
    """Return rolling mean of given values, using specified window size."""
    return values.rolling(window=window).mean()


def get_rolling_std(values, window):
    """Return rolling standard deviation of given values, using specified window size."""
    # TODO: Compute and return rolling standard deviation
    return values.rolling(window=window).std()


def get_bollinger_bands(rm, rstd):
    """Return upper and lower Bollinger Bands."""
    # TODO: Compute upper_band and lower_band
    upper_band = rstd * 2 + rm
    lower_band =  rm - rstd * 2
    return upper_band, lower_band


def test_run():
    # Read data
    dates = pd.date_range('2012-01-01', '2012-12-31')
    symbols = ['SPY']
    df = get_data(symbols, dates)

    # Compute Bollinger Bands
    # 1. Compute rolling mean
    rm_SPY = get_rolling_mean(df['SPY'], window=20)

    # 2. Compute rolling standard deviation
    rstd_SPY = get_rolling_std(df['SPY'], window=20)

    # 3. Compute upper and lower bands
    upper_band, lower_band = get_bollinger_bands(rm_SPY, rstd_SPY)

    # Plot raw SPY values, rolling mean and Bollinger Bands
    ax = df['SPY'].plot(title="Bollinger Bands", label='SPY')
    rm_SPY.plot(label='Rolling mean', ax=ax)
    upper_band.plot(label='upper band', ax=ax)
    lower_band.plot(label='lower band', ax=ax)

    # Add axis labels and legend
    ax.set_xlabel("Date")
    ax.set_ylabel("Price")
    ax.legend(loc='upper left')
    plt.show()


if __name__ == "__main__":
    test_run()
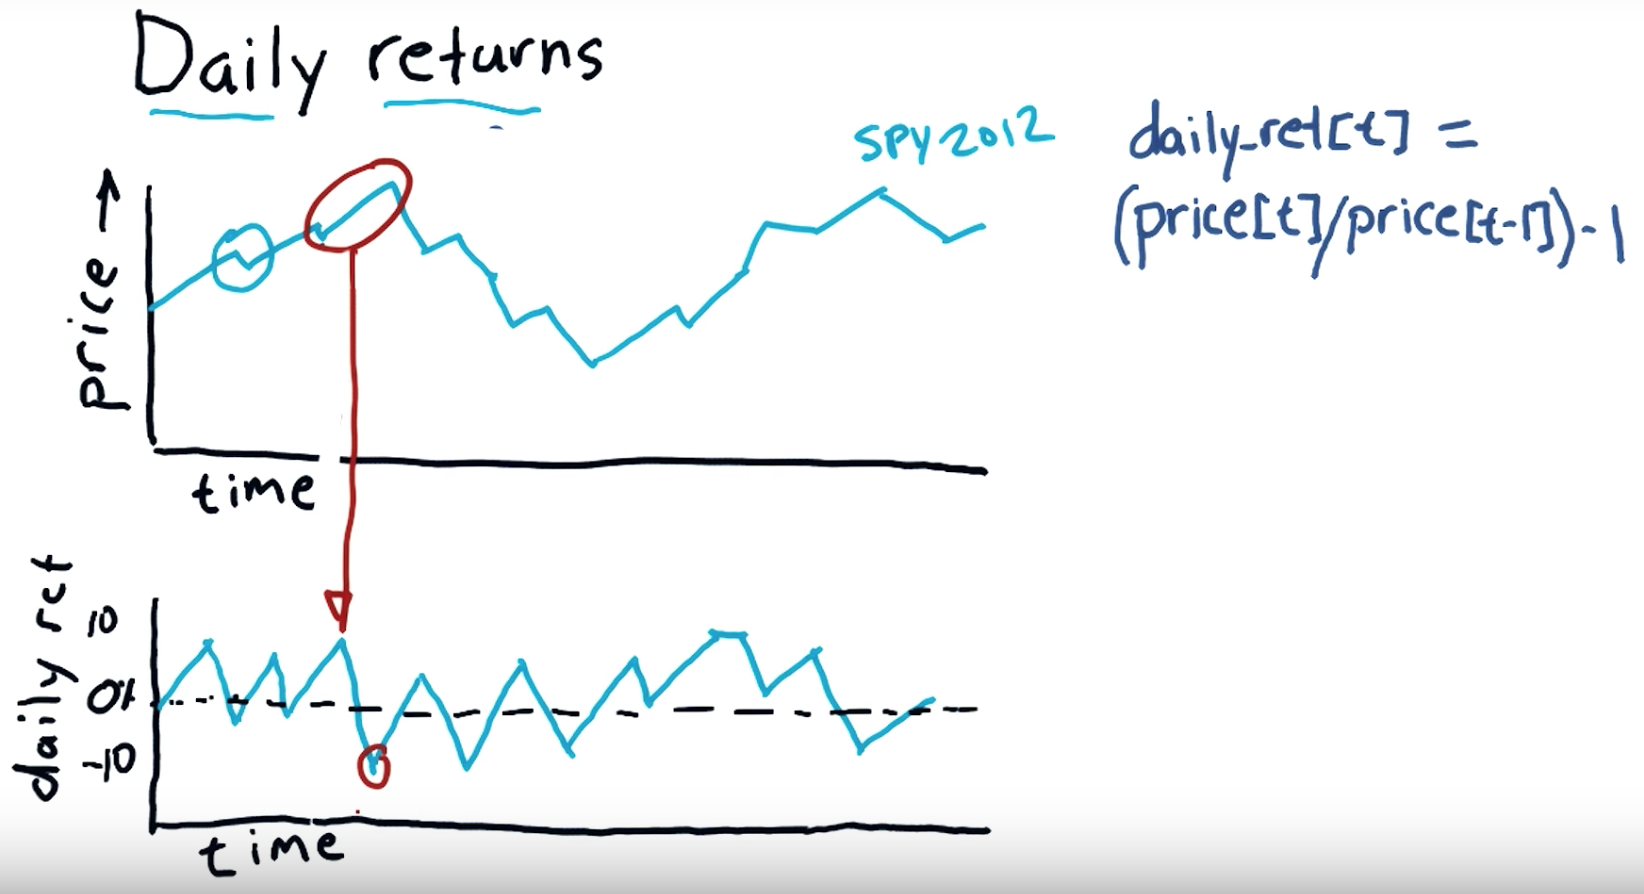
Daily return:
Subtract the previous day's closing price from the most recent day's closing price. In this example, subtract $35.50 from $36.75 to get $1.25. Divide your Step 4 result by the previous day's closing price to calculate the daily return. Multiply this result by 100 to convert it to a percentage.
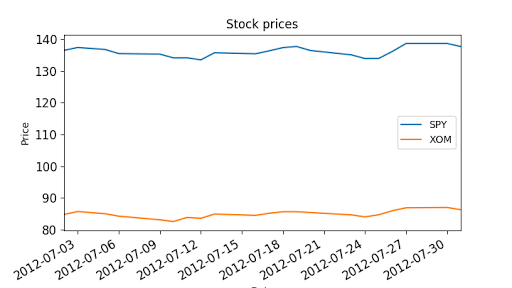
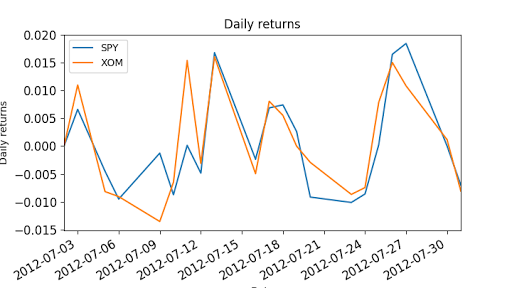
"""Compute daily returns."""

import os
import pandas as pd
import matplotlib.pyplot as plt

def symbol_to_path(symbol, base_dir="data"):
    """Return CSV file path given ticker symbol."""
    return os.path.join(base_dir, "{}.csv".format(str(symbol)))


def get_data(symbols, dates):
    """Read stock data (adjusted close) for given symbols from CSV files."""
    df = pd.DataFrame(index=dates)
    if 'SPY' not in symbols:  # add SPY for reference, if absent
        symbols.insert(0, 'SPY')

    for symbol in symbols:
        df_temp = pd.read_csv(symbol_to_path(symbol), index_col='Date',
                parse_dates=True, usecols=['Date', 'Adj Close'], na_values=['nan'])
        df_temp = df_temp.rename(columns={'Adj Close': symbol})
        df = df.join(df_temp)
        if symbol == 'SPY':  # drop dates SPY did not trade
            df = df.dropna(subset=["SPY"])

    return df


def plot_data(df, title="Stock prices", xlabel="Date", ylabel="Price"):
    """Plot stock prices with a custom title and meaningful axis labels."""
    ax = df.plot(title=title, fontsize=12)
    ax.set_xlabel(xlabel)
    ax.set_ylabel(ylabel)
    plt.show()


def compute_daily_returns(df):
    """Compute and return the daily return values."""
    # TODO: Your code here
    # Note: Returned DataFrame must have the same number of rows
    return df / df.shift(-1) -1


def test_run():
    # Read data
    dates = pd.date_range('2012-07-01', '2012-07-31')  # one month only
    symbols = ['SPY','XOM']
    df = get_data(symbols, dates)
    plot_data(df)

    # Compute daily returns
    daily_returns = compute_daily_returns(df)
    plot_data(daily_returns, title="Daily returns", ylabel="Daily returns")


if __name__ == "__main__":
    test_run()
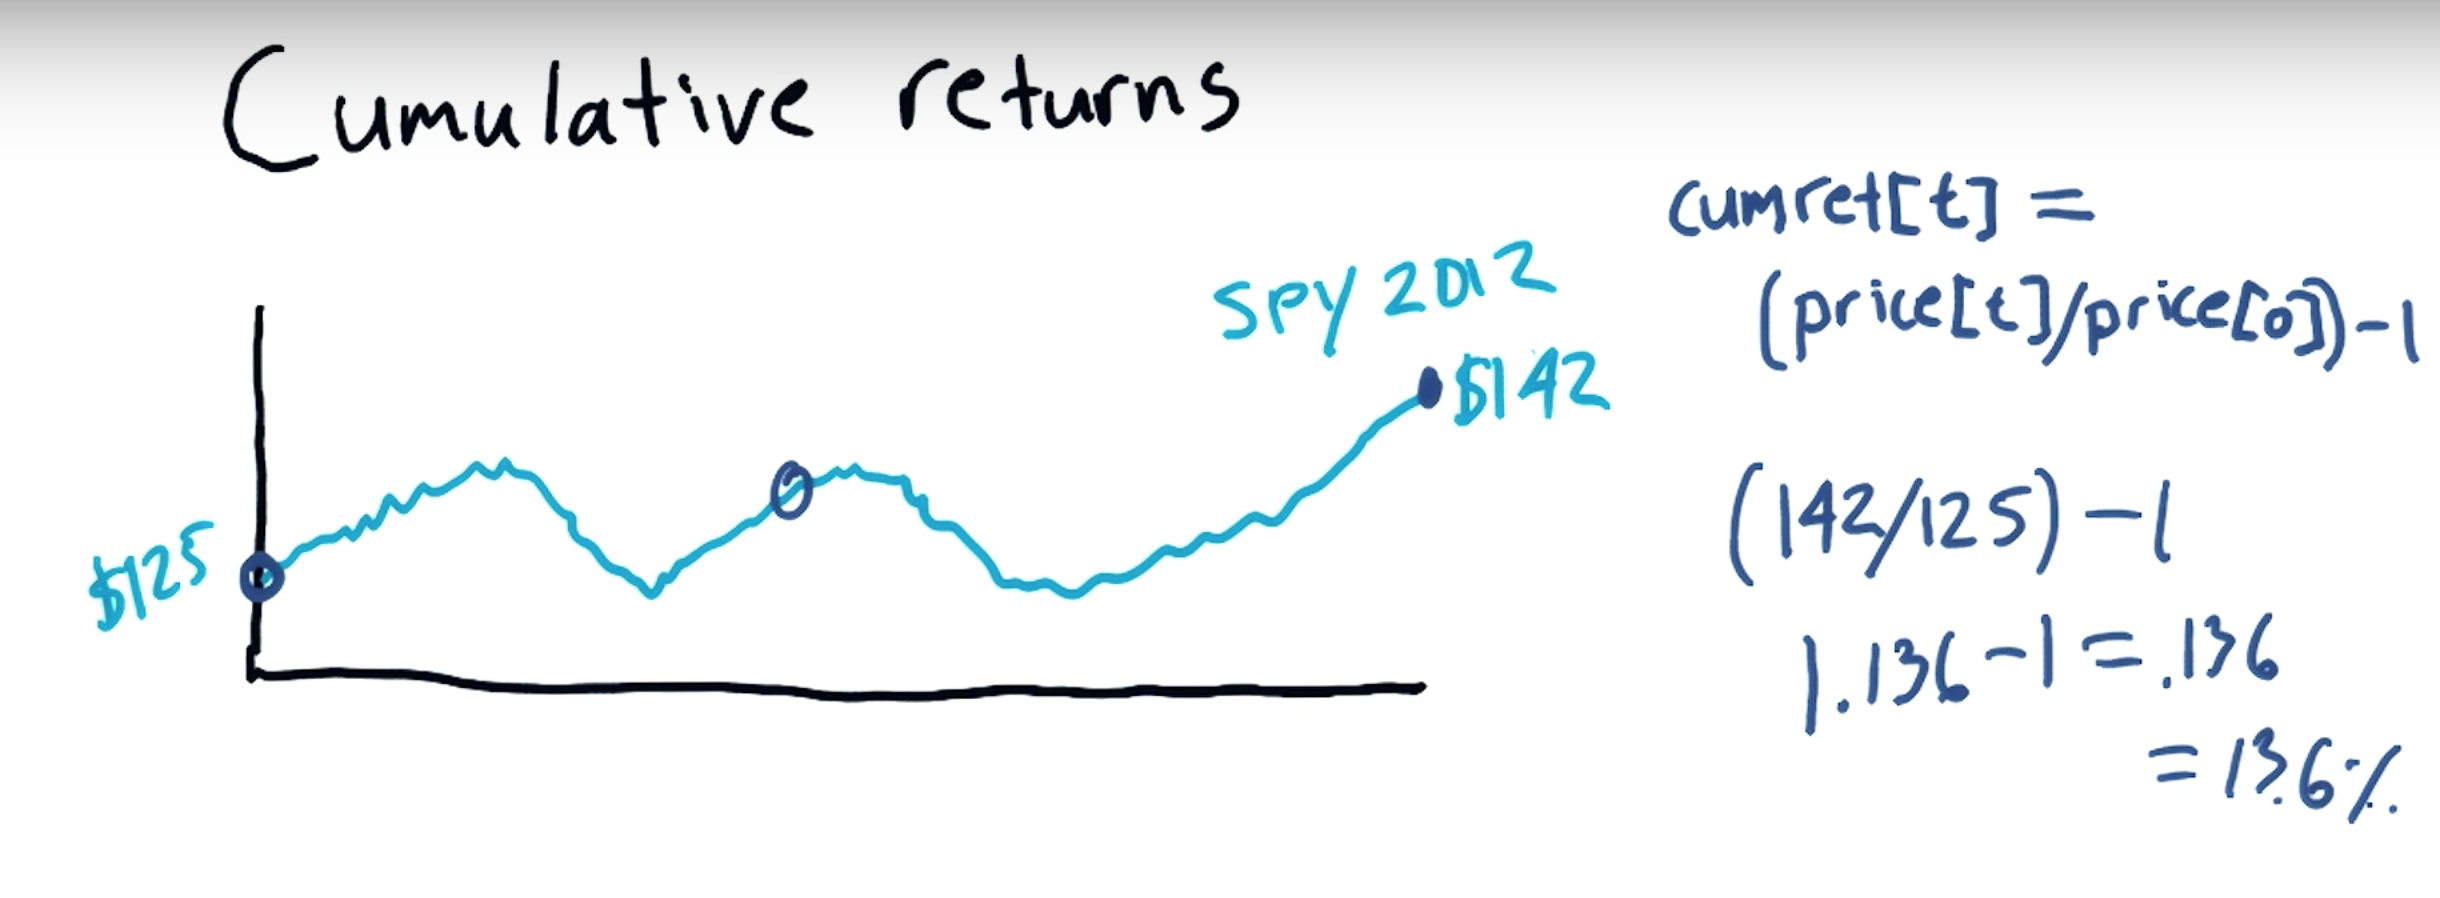
Cumulative return:
an investment relative to the principal amount invested over a specified amount of time. ... To calculate cumulative return, subtract the original price of the investment from the current price and divide that difference by the original price.
相关文章
- python读写文件write和flush
- Python第二次学习知识点总结
- python自动化测试之连接几组测试包实例
- 一些Python中的二维数组的操作方法
- Python - 网络爬虫(Web Scraping)
- python paramiko ssh.exec_command()启动tomcat服务器应用进程失败问题解决方法- Neither the JAVA_HOME nor the JRE_HOME environment variable is defined At least one of these environment variable is needed to run this progr
- python工具——basemap使用一基本使用
- Linux系统创建python虚拟环境
- [Python] Array Attributes of Numpy lib
- 成功解决Python中出现的TypeError: object of type 'zip' has no len()
- 价值9890元的600集Python教程,在此透露给大家!速度来拿哇
- 又一个 Jupyter 神器,操作 Excel 自动生成 Python 代码
- python操作toml文件
- python 设计模式之 (Chain of Responsibility)责任链模式
- Python使用4个空格替换Tab, TabError: inconsistent use of tabs and spaces in indentation。
- 这样学Python,数据分析从0到1轻松入门(上)
- Python threadpool传递参数
- 【python】解决json.dump(字典)时报错Object of type ‘float32‘ is not JSON serializable
- 【Python学习moviepy库剪辑视频】—— 筑梦之路