
Istio(六):Istio弹性(超时&重试)和故障注入
一.模块概览
Istio弹性(超时&重试)和故障注入都是为了能更好的应对故障,在故障发生后将服务恢复到一个完全正常的状态。
使用Istio弹性(超时&重试)和故障注入的前提是已经安装好了istio,关于istio的安装部署,请查看博客《Istio(二):在Kubernetes(k8s)集群上安装部署istio1.14》https://www.cnblogs.com/renshengdezheli/p/16836404.html
二.系统环境
| 服务器版本 | docker软件版本 | Kubernetes(k8s)集群版本 | Istio软件版本 | CPU架构 |
|---|---|---|---|---|
| CentOS Linux release 7.4.1708 (Core) | Docker version 20.10.12 | v1.21.9 | Istio1.14 | x86_64 |
Kubernetes集群架构:k8scloude1作为master节点,k8scloude2,k8scloude3作为worker节点
| 服务器 | 操作系统版本 | CPU架构 | 进程 | 功能描述 |
|---|---|---|---|---|
| k8scloude1/192.168.110.130 | CentOS Linux release 7.4.1708 (Core) | x86_64 | docker,kube-apiserver,etcd,kube-scheduler,kube-controller-manager,kubelet,kube-proxy,coredns,calico | k8s master节点 |
| k8scloude2/192.168.110.129 | CentOS Linux release 7.4.1708 (Core) | x86_64 | docker,kubelet,kube-proxy,calico | k8s worker节点 |
| k8scloude3/192.168.110.128 | CentOS Linux release 7.4.1708 (Core) | x86_64 | docker,kubelet,kube-proxy,calico | k8s worker节点 |
三.弹性(超时&重试)
3.1 弹性
弹性(Resiliency)是指在面对故障和对正常运行的挑战时,提供和保持可接受的服务水平的能力。这不是为了避免故障,而是以一种没有停机或数据丢失的方式来应对故障。弹性的目标是在故障发生后将服务恢复到一个完全正常的状态。
使服务可用的一个关键因素是在提出服务请求时使用超时(timeout)和重试(retry)策略。我们可以在 Istio 的 VirtualService 上配置这两者。
使用超时字段,我们可以为 HTTP 请求定义一个超时。如果请求的时间超过了超时字段中指定的值,Envoy 代理将放弃请求,并将其标记为超时(向应用程序返回一个 HTTP 408)。连接将保持开放,除非触发了异常点检测。下面是一个为路由设置超时的例子:
 ...
 - route:
   - destination:
       host: customers.default.svc.cluster.local
       subset: v1
   timeout: 10s
 ...
除了超时之外,我们还可以配置更细化的重试策略。我们可以控制一个给定请求的重试次数,每次尝试的超时时间,以及我们想要重试的具体条件。
例如,我们可以只在上游服务器返回 5xx 响应代码时重试请求,或者只在网关错误(HTTP 502、503 或 504)时重试,或者甚至在请求头中指定可重试的状态代码。重试和超时都发生在客户端。当 Envoy 重试一个失败的请求时,最初失败并导致重试的端点就不再包含在负载均衡池中了。假设 Kubernetes 服务有 3 个端点(Pod),其中一个失败了,并出现了可重试的错误代码。当 Envoy 重试请求时,它不会再向原来的端点重新发送请求。相反,它将把请求发送到两个没有失败的端点中的一个。
下面是一个例子,说明如何为一个特定的目的地设置重试策略。
 ...
 - route:
   - destination:
       host: customers.default.svc.cluster.local
       subset: v1
   retries:
     attempts: 10
     perTryTimeout: 2s
     retryOn: connect-failure,reset
 ...
上述重试策略将尝试重试任何连接超时(connect-failure)或服务器完全不响应(reset)的失败请求。我们将每次尝试的超时时间设置为 2 秒,尝试的次数设置为 10 次。注意,如果同时设置重试和超时,超时值将是请求等待的最长时间。如果我们在上面的例子中指定了 10 秒的超时,那么即使重试策略中还剩下一些尝试,我们也只能最多等待 10 秒。
关于重试策略的更多细节,请参阅 x-envoy-retry-on 文档。
四.故障注入
4.1 故障注入
为了帮助我们提高服务的弹性,我们可以使用故障注入功能。我们可以在 HTTP 流量上应用故障注入策略,在转发目的地的请求时指定一个或多个故障注入。
有两种类型的故障注入。我们可以在转发前延迟(delay)请求,模拟缓慢的网络或过载的服务,我们可以中止(abort) HTTP 请求,并返回一个特定的 HTTP 错误代码给调用者。通过中止,我们可以模拟一个有故障的上游服务。
下面是一个中止 HTTP 请求并返回 HTTP 404 的例子,针对 30% 的传入请求。
 - route:
   - destination:
       host: customers.default.svc.cluster.local
       subset: v1
   fault:
     abort:
       percentage:
         value: 30
       httpStatus: 404
如果我们不指定百分比,所有的请求将被中止。请注意,故障注入会影响使用该 VirtualService 的服务。它并不影响该服务的所有消费者。
同样地,我们可以使用 fixedDelay 字段对请求应用一个可选的延迟。
 - route:
   - destination:
       host: customers.default.svc.cluster.local
       subset: v1
   fault:
     delay:
       percentage:
         value: 5
       fixedDelay: 3s
上述设置将对 5% 的传入请求应用 3 秒的延迟。
注意,故障注入将不会触发我们在路由上设置的任何重试策略。例如,如果我们注入了一个 HTTP 500 的错误,配置为在 HTTP 500 上的重试策略将不会被触发。
五.实战:观察错误注入
5.1 在 Grafana、Zipkin 和 Kiali 中观察故障注入和延迟情况
在这个实验中,我们将部署 Web 前端和 Customer V1 服务。然后,我们将在 Zipkin、Kiali 和 Grafana 中注入故障和延迟,并观察它们。
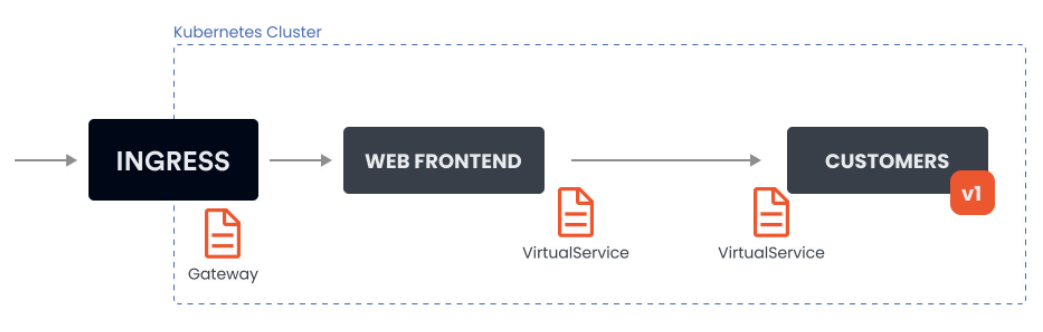
我们先部署 Gateway:
[root@k8scloude1 istioyaml]# vim ingressgateway80.yaml

#网关暴露80端口
[root@k8scloude1 istioyaml]# cat ingressgateway80.yaml
apiVersion: networking.istio.io/v1alpha3
kind: Gateway
metadata:
  name: ingressgateway80
spec:
  selector:
    istio: ingressgateway
  servers:
    - port:
        number: 80
        name: http
        protocol: HTTP
      hosts:
        - '*'

[root@k8scloude1 istioyaml]# kubectl apply -f ingressgateway80.yaml
gateway.networking.istio.io/ingressgateway80 created

#网关创建成功
[root@k8scloude1 istioyaml]# kubectl get gateway -o wide
NAME               AGE
ingressgateway80   50s
接下来,我们将部署 Web Frontend、Service 和 VirtualService。
  apiVersion: apps/v1
  kind: Deployment
  metadata:
    name: web-frontend
    labels:
      app: web-frontend
  spec:
    replicas: 1
    selector:
      matchLabels:
        app: web-frontend
    template:
      metadata:
        labels:
          app: web-frontend
          version: v1
      spec:
        containers:
          - image: gcr.io/tetratelabs/web-frontend:1.0.0
            imagePullPolicy: Always
            name: web
            ports:
              - containerPort: 8080
            env:
              - name: CUSTOMER_SERVICE_URL
                value: 'http://customers.default.svc.cluster.local'
  ---
  kind: Service
  apiVersion: v1
  metadata:
    name: web-frontend
    labels:
      app: web-frontend
  spec:
    selector:
      app: web-frontend
    ports:
      - port: 80
        name: http
        targetPort: 8080
  ---
  apiVersion: networking.istio.io/v1alpha3
  kind: VirtualService
  metadata:
    name: web-frontend
  spec:
    hosts:
      - '*'
    gateways:
      - gateway
    http:
      - route:
          - destination:
              host: web-frontend.default.svc.cluster.local
              port:
                number: 80
将上述 YAML 保存为 web-frontend.yaml,并使用 kubectl apply -f web-frontend.yaml 创建资源。
最后,我们将部署 Customers v1 和相应的资源。
  apiVersion: apps/v1
  kind: Deployment
  metadata:
    name: customers-v1
    labels:
      app: customers
      version: v1
  spec:
    replicas: 1
    selector:
      matchLabels:
        app: customers
        version: v1
    template:
      metadata:
        labels:
          app: customers
          version: v1
      spec:
        containers:
          - image: gcr.io/tetratelabs/customers:1.0.0
            imagePullPolicy: Always
            name: svc
            ports:
              - containerPort: 3000
  ---
  kind: Service
  apiVersion: v1
  metadata:
    name: customers
    labels:
      app: customers
  spec:
    selector:
      app: customers
    ports:
      - port: 80
        name: http
        targetPort: 3000
  ---
  apiVersion: networking.istio.io/v1alpha3
  kind: DestinationRule
  metadata:
    name: customers
  spec:
    host: customers.default.svc.cluster.local
    subsets:
      - name: v1
        labels:
          version: v1
  ---
  apiVersion: networking.istio.io/v1alpha3
  kind: VirtualService
  metadata:
    name: customers
  spec:
    hosts:
      - 'customers.default.svc.cluster.local'
    http:
      - route:
          - destination:
              host: customers.default.svc.cluster.local
              port:
                number: 80
              subset: v1
        fault:
          delay:
            percent: 50
            fixedDelay: 5s
将上述 YAML 保存为 customers-delay.yaml,并使用 kubectl apply -f customers-delay.yaml 更新 VirtualService。
为了产生一些流量,让我们打开一个单独的终端窗口,开始向 GATEWAY_URL 发出无穷的循环请求。
while true; do curl http://$GATEWAY_URL/; done
我们应该开始注意到一些请求的时间比平时长。让我们打开 Grafana 并观察这些延迟。
$ getmesh istioctl dash grafana
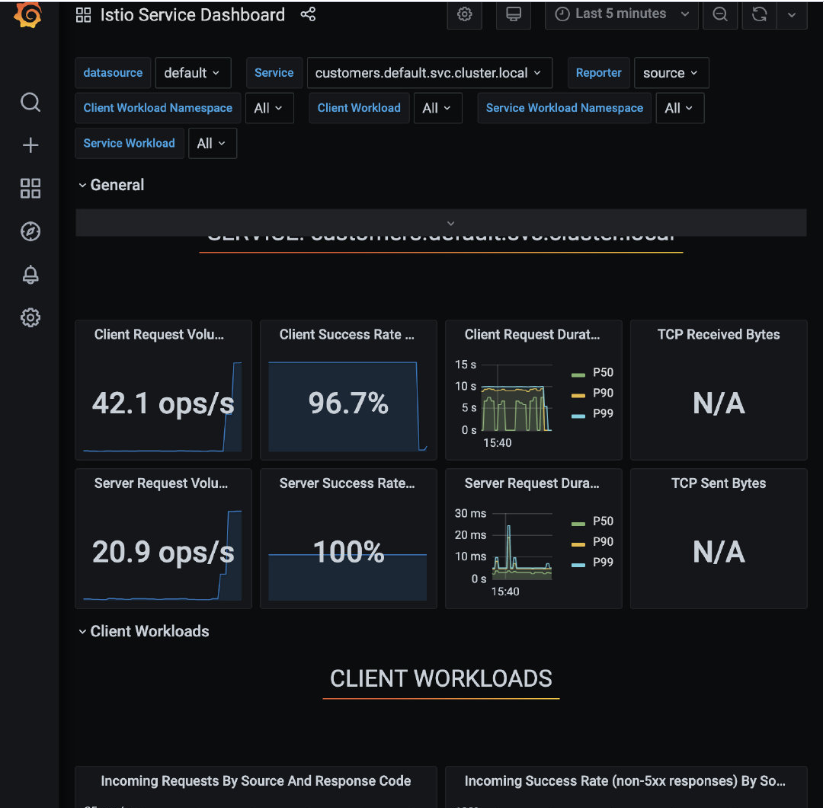
当 Grafana 打开时,点击主页和 Istio Service Dashboard。在仪表板上,确保在服务下拉菜单中选择 customers.default.svc.cluster.local。
如果你展开 Client Workload 面板,你会发现客户端请求持续时间图上的持续时间增加了,如下图所示。
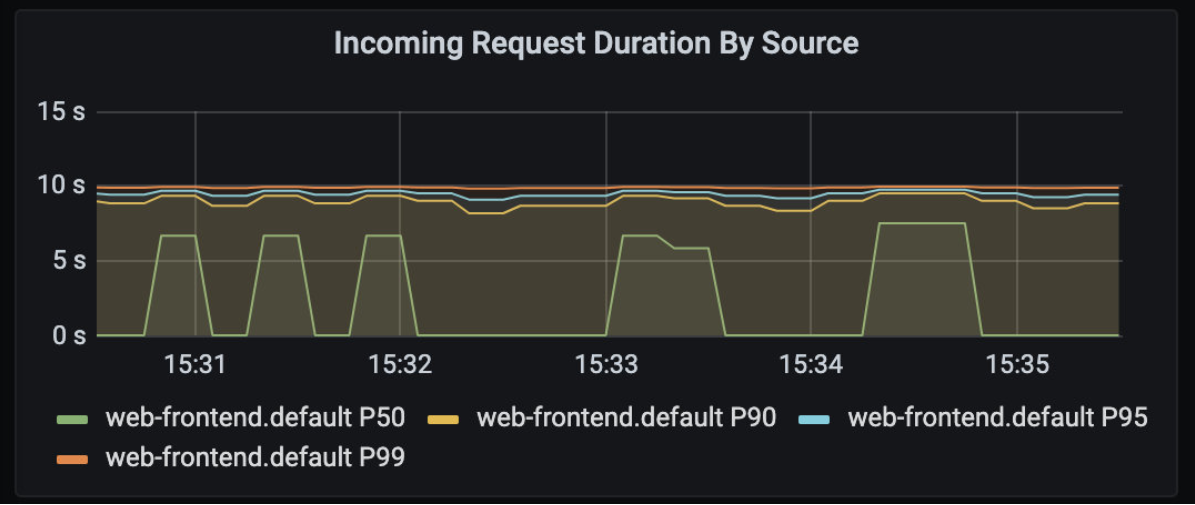
你可以注意到 web-frontend.default.svc.cluster.local 服务方面也有同样的延迟。
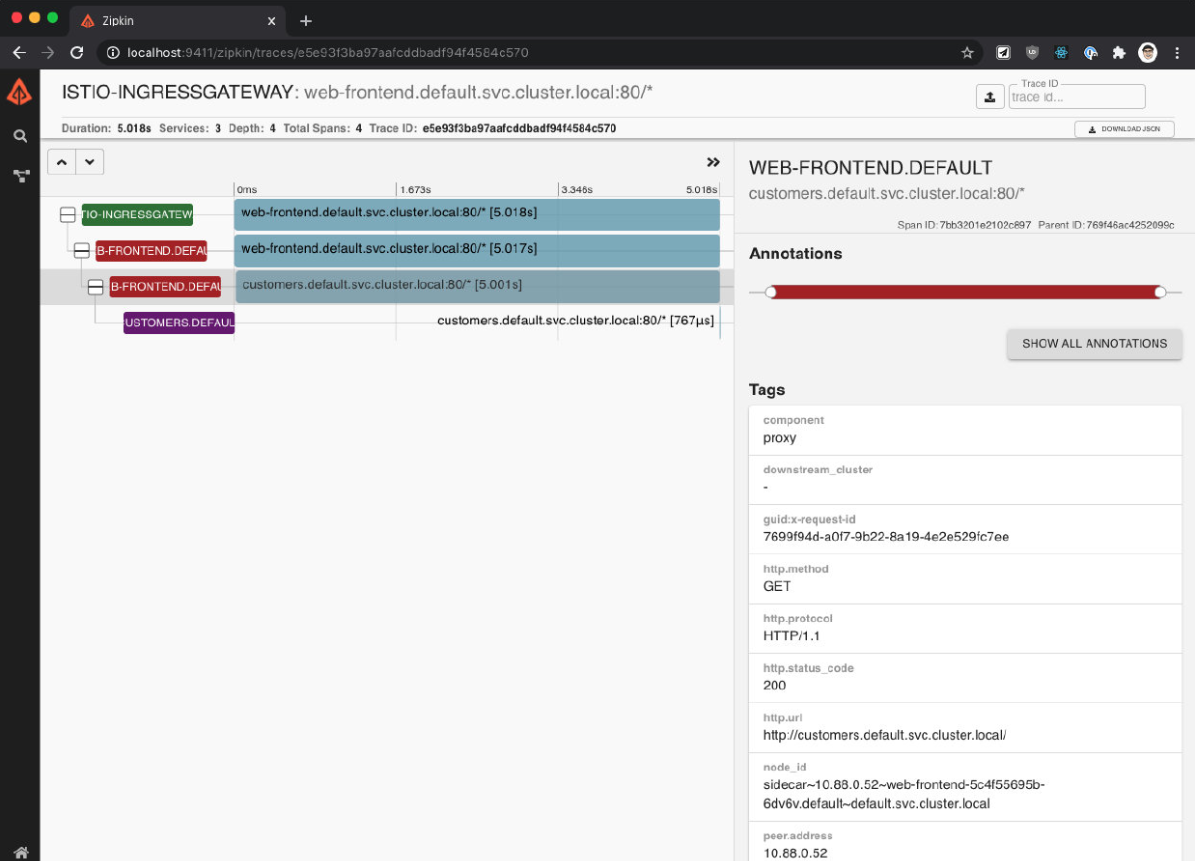
让我们看看这个延迟在 Zipkin 中是如何显示的。用 getmesh istioctl dash zipkin 打开Zipkin。在主屏幕上,选择 serviceName 和 web-frontend.default,然后添加minDuration 条件,输入 5s,点击搜索按钮,找到 trace。
点击其中一个 trace,打开详细信息页面。在详情页上,我们会发现持续时间是 5 秒。
单个 trace 有 4 个 span——点击 3 个跨度,代表从 web-frontend 到客户服务的请求。
你会注意到在细节中,response_flags 标签设置为 DI。"DI" 代表 "延迟注入",表示该请求被延迟了。
让我们再次更新 VirtualService,这一次,我们将注入一个故障,对 50% 的请求返回 HTTP 500。
  apiVersion: networking.istio.io/v1alpha3
  kind: VirtualService
  metadata:
    name: customers
  spec:
    hosts:
      - 'customers.default.svc.cluster.local'
    http:
      - route:
          - destination:
              host: customers.default.svc.cluster.local
              port:
                number: 80
              subset: v1
        fault:
          abort:
            httpStatus: 500
            percentage:
              value: 50
将上述 YAML 保存为 customers-fault.yaml,然后用 kubectl apply -f customers-fault.yaml 更新 VirtualService。
就像前面一样,我们将开始注意到来自请求循环的失败。如果我们回到 Grafana 并打开 Istio Service Dashboard,我们会注意到客户端的成功率在下降,并且在按来源和响应代码划分的传入请求图上 500 响应在增加,如图所示。
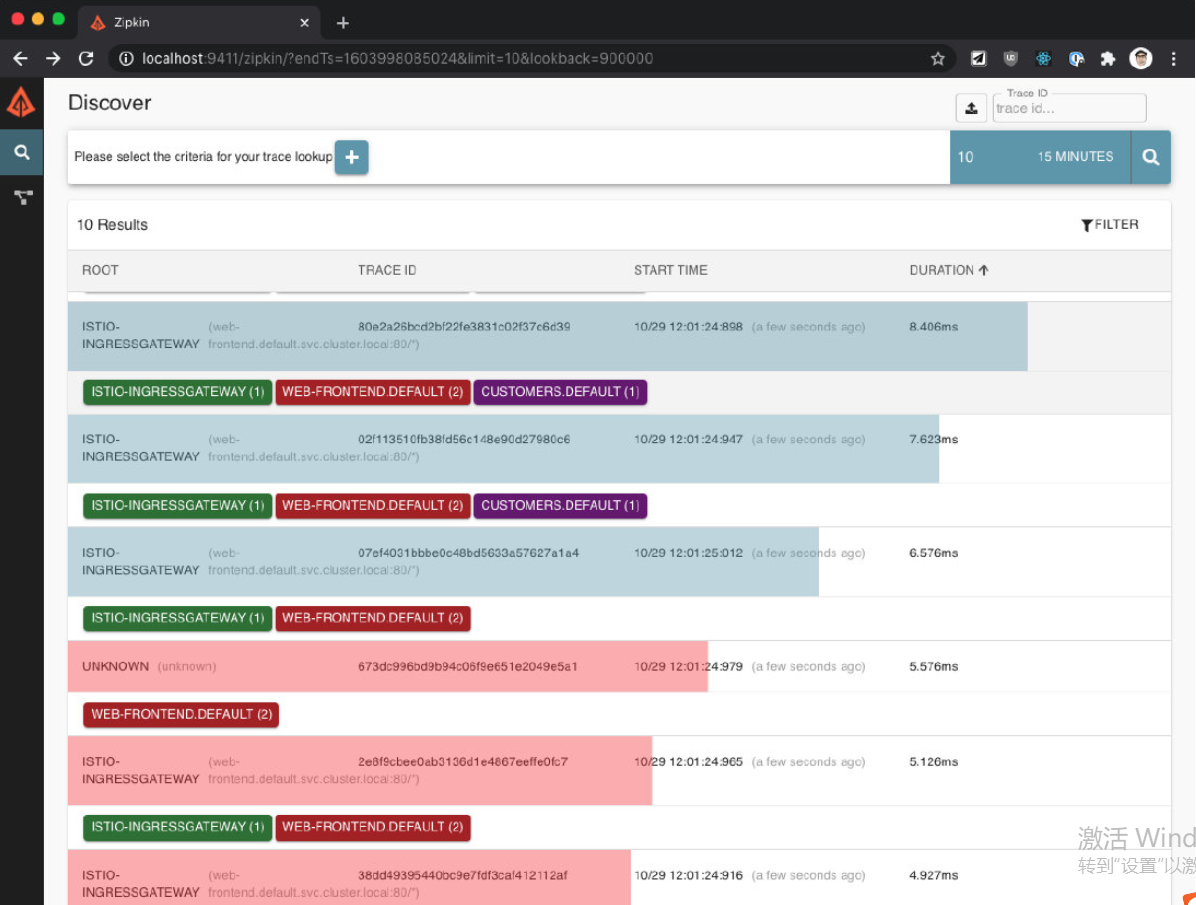
在 Zipkin 中也有类似的情况。如果我们再次搜索 trace(我们可以删除最小持续时间),我们会发现有错误的 trace 会以红色显示,如下图所示。
让我们也打开 Kiali(getmesh istioctl dash kiali),通过点击 Graph 项查看服务图。你会注意到 web-frontend 服务有一个红色的边框,如下图所示。
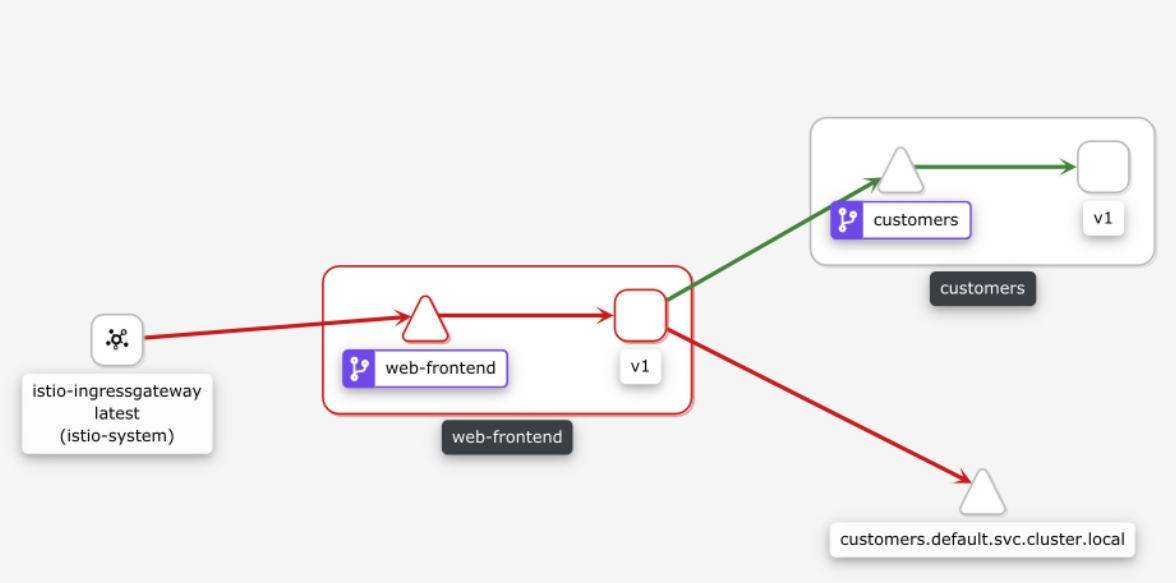
如果我们点击 web-frontend 服务,看看右边的侧边栏,你会发现 HTTP 请求的细节。图中显示了成功和失败的百分比,这两个数字都在 50% 左右,这与我们在 VirtualService 中设置的百分比值相一致。
5.2 清理
删除 Deployment、Service、VirtualService、DestinationRule 和 Gateway。
  kubectl delete deploy web-frontend customers-v1
  kubectl delete svc customers web-frontend
  kubectl delete vs customers web-frontend
  kubectl delete gateway gateway
相关文章
- JetBrains Rider for mac(跨平台.NET IDE集成开发) v2022.3.1激活版
- 交互周期表:网络中心度(Network Centrality)
- ECCV2022 | PCLossNet:不进行匹配的点云重建网络
- Redis
- SQLSERVER 的复合索引和包含索引到底有啥区别?
- SQLSERVER 的主键索引真的是物理有序吗?
- SQLSERVER 居然也能调 C# 代码 ?
- 再聊一下那 SQLSERVER 行不能跨页的事
- 聊一聊 SQLSERVER 的行不能跨页
- 一次SQL调优 聊一聊 SQLSERVER 数据页
- 记一次 .NET 某安全生产信息系统 CPU爆高分析
- 记一次 .NET 某工控MES程序 崩溃分析
- 玩好.NET高级调试,你也要会写点汇编
- 记一次 .NET 某工控软件 内存泄露分析
- 记一次 .NET 某电子厂OA系统 非托管内存泄露分析
- 聊一聊如何截获 C# 程序产生的日志
- .NET 7 的 AOT 到底能不能扛反编译?
- 记一次 .NET 某自动化采集软件 崩溃分析
- 从 WinDbg 角度理解 .NET7 的AOT玩法
- 记一次.NET某工控图片上传CPU爆高分析