Chart.js-饼状图分析(参数分析+例图)
2023-03-14 22:53:25 时间
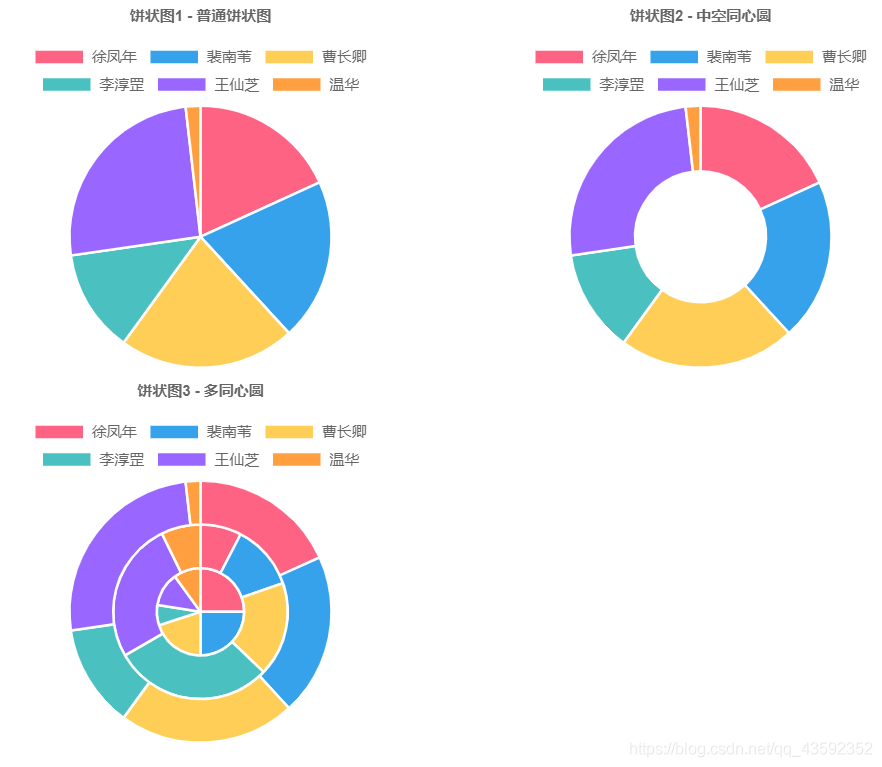
饼状图样式总览

基本写法
首先在< script >标签里面引入chart.js:
<script src="chart.js/Chart.js"></script>然后创建一个画布:
<canvas id="myChart" width="400" height="400"></canvas>最后写js代码:
var ctx = $('#myChart1');
var myChart = new Chart(ctx, {
    type: 'pie',
    data: {
        labels: ['徐凤年', '裴南苇', '曹长卿', '李淳罡', '王仙芝', '温华'],
        datasets: [{
            label: '# of 战力',
            data: [100, 110, 120, 70, 140, 10],
            backgroundColor: [
                'rgba(255, 99, 132,1)',
                'rgba(54, 162, 235,1)',
                'rgba(255, 206, 86,1)',
                'rgba(75, 192, 192,1)',
                'rgba(153, 102, 255,1)',
                'rgba(255, 159, 64,1)'
            ],
            borderColor:'white',
            borderWidth: 2,
            fill:false
        }]
    },
    options: {
        title: {
                display: true,
                text: '饼状图1 - 普通饼状图'
            }
    }
});
参数解析
【注意】以下都是写入在datasets中的参数:
| 参数名 | 类型 | 说明 | 默认值 |
backgroundColor | Color | 背景色。如果值为Array,只取Array[0] | 'rgba(0, 0, 0, 0.1)' |
borderColor | Color | 边框色。可取Array类型的Color | 'rgba(0, 0, 0, 0.1)' |
borderWidth | number | 略 | 3 |
hoverBackgroundColor | Color | 略 | undefined |
hoverBorderColor | Color | 略 | undefined |
hoverBorderWidth | number | 略 | undefined |
label | string | 标签,图例和工具提示中的数据集标签。 | '' |
data | object[] | required | 数据结构为数组,是柱状图对应的值。 |
# 饼状图1 - 普通饼状图
var ctx = $('#myChart1');
var myChart = new Chart(ctx, {
    type: 'pie',
    data: {
        labels: ['徐凤年', '裴南苇', '曹长卿', '李淳罡', '王仙芝', '温华'],
        datasets: [{
            label: '# of 战力',
            data: [100, 110, 120, 70, 140, 10],
            backgroundColor: [
                'rgba(255, 99, 132,1)',
                'rgba(54, 162, 235,1)',
                'rgba(255, 206, 86,1)',
                'rgba(75, 192, 192,1)',
                'rgba(153, 102, 255,1)',
                'rgba(255, 159, 64,1)'
            ],
            borderColor:'white',
            borderWidth: 2
        }]
    },
    options: {
        title: {
                display: true,
                text: '饼状图1 - 普通饼状图'
            }
    }
});
饼状图2 - 中空同心圆
var ctx2 = $('#myChart2');
var myChart = new Chart(ctx2, {
    type: 'doughnut',
    data: {
        labels: ['徐凤年', '裴南苇', '曹长卿', '李淳罡', '王仙芝', '温华'],
        datasets: [{
            label: '# of 战力',
            data: [100, 110, 120, 70, 140, 10],
            backgroundColor: [
                'rgba(255, 99, 132,1)',
                'rgba(54, 162, 235,1)',
                'rgba(255, 206, 86,1)',
                'rgba(75, 192, 192,1)',
                'rgba(153, 102, 255,1)',
                'rgba(255, 159, 64,1)'
            ],
            borderColor:'white',
            borderWidth: 2,
            fill:false
        }]
    },
    options: {
        title: {
                display: true,
                text: '饼状图2 - 中空同心圆'
            }
    }
});
饼状图3 - 多同心圆
var ctx3 = $('#myChart3');
var myChart = new Chart(ctx3, {
    type: 'pie',
    data: {
        labels: ['徐凤年', '裴南苇', '曹长卿', '李淳罡', '王仙芝', '温华'],
        datasets: [{
            label: '# of 战力',
            data: [100, 110, 120, 70, 140, 10],
            backgroundColor: [
                'rgba(255, 99, 132,1)',
                'rgba(54, 162, 235,1)',
                'rgba(255, 206, 86,1)',
                'rgba(75, 192, 192,1)',
                'rgba(153, 102, 255,1)',
                'rgba(255, 159, 64,1)'
            ],
            borderColor:'white',
            borderWidth: 2,
            fill:false
        },{
            label: '# of 年龄',
            data: [24, 38, 55, 93, 82, 23],
            backgroundColor: [
                'rgba(255, 99, 132,1)',
                'rgba(54, 162, 235,1)',
                'rgba(255, 206, 86,1)',
                'rgba(75, 192, 192,1)',
                'rgba(153, 102, 255,1)',
                'rgba(255, 159, 64,1)'
            ],
            borderColor:'white',
            borderWidth: 2,
            lineTension:0,
            fill:false,
            lineTension:1
        },{
            label: '# of 相貌',
            data: [10, 10, 8, 3, 5, 4],
            backgroundColor: [
                'rgba(255, 99, 132,1)',
                'rgba(54, 162, 235,1)',
                'rgba(255, 206, 86,1)',
                'rgba(75, 192, 192,1)',
                'rgba(153, 102, 255,1)',
                'rgba(255, 159, 64,1)'
            ],
            borderColor:'white',
            borderWidth: 2,
            fill:false,
            borderDash:[5]
        }]
    },
    options: {
        title: {
                display: true,
                text: '饼状图3 - 多同心圆'
            }
    }
});
相关文章
- 在 Go 里用 CGO?这 7 个问题你要关注!
- 9款优秀的去中心化通讯软件 Matrix 的客户端
- 求职数据分析,项目经验该怎么写
- 在OKR中,我看到了数据驱动业务的未来
- 火山引擎云原生大数据在金融行业的实践
- OpenHarmony富设备移植指南(二)—从postmarketOS获取移植资源
- 《数据成熟度指数》报告:64%的企业领袖认为大多数员工“不懂数据”
- OpenHarmony 小型系统兼容性测试指南
- 肯睿中国(Cloudera):2023年企业数字战略三大趋势预测
- 适用于 Linux 的十大命令行游戏
- GNOME 截图工具的新旧截图方式
- System76 即将推出的 COSMIC 桌面正在酝酿大变化
- 2GB 内存 8GB 存储即可流畅运行,Windows 11 极致精简版系统 Tiny11 发布
- 迎接 ecode:一个即将推出的具有全新图形用户界面框架的现代、轻量级代码编辑器
- loongarch架构介绍(三)—地址翻译
- Go 语言怎么解决编译器错误“err is shadowed during return”?
- 敏捷:可能被开发人员遗忘的部分
- Denodo预测2023年数据管理和分析的未来
- 利用数据推动可持续发展
- 在 Vue3 中实现 React 原生 Hooks(useState、useEffect),深入理解 React Hooks 的

