
如何在 ASP.Net Core 中使用 MiniProfiler

本文转载自微信公众号「码农读书」,作者码农读书 。转载本文请联系码农读书公众号。
web应用程序的性能相信是大家普遍关心的一个问题,也相信大家有很多工具可用来分析应用程序的性能并能够找到其中的瓶颈,MiniProfiler 就是这个领域中的一款产品,它是一款简单的,功能强大的web应用分析工具,MiniProfiler 可用来帮助我们找到 慢查询, 慢响应 等问题。
MiniProfiler 可用在 Asp.Net 和 ASP.Net Core 中,这篇文章将会讨论如何使用 MiniProfiler,并通过它找到应用程序的性能问题。
安装 MiniProfiler
要想使用 MiniProfiler,需要通过 nuget 引用 MiniProfiler.AspNetCore.Mvc 包,可以通过 Visual Studio 2019 的 NuGet package manager 可视化界面安装 或者 通过 NuGet package manager 命令行工具输入以下命令:
- dotnet add package MiniProfiler.AspNetCore.Mvc
安装好之后,接下来就要将 MiniProfiler 注入到 ServiceCollection 容器中,如下代码所示:
- // This method gets called by the runtime. Use this method to add services to the container.
- public void ConfigureServices(IServiceCollection services)
- {
- services.AddControllersWithViews();
- services.AddMiniProfiler(options => options.RouteBasePath = "/profiler");
- }
注入好之后,接下来就需要使用 UseMiniProfiler 扩展方法将其注入到 Request Pipeline 管道中,如下代码所示:
- public void Configure(IApplicationBuilder app, IWebHostEnvironment env, ILoggerFactory loggerFactory)
- {
- app.UseMiniProfiler();
- app.UseEndpoints(endpoints =>
- {
- endpoints.MapControllerRoute(
- name: "default",
- pattern: "{controller=Home}/{action=Index}/{id?}");
- });
- }
然后在 _Layout.cshtml 页面中增加如下两行命令。
- @using StackExchange.Profiling
- @addTagHelper *, MiniProfiler.AspNetCore.Mvc
最后需要在 WebPage 中指定 MiniProfiler 分析窗口应该显示的位置,那如何做呢?在 body 标签内使用 mini-profiler 标记,如下代码所示:
- <mini-profiler position="@RenderPosition.Right" max-traces="5" />
在 ASP.Net Core MVC 中使用 MiniProfiler
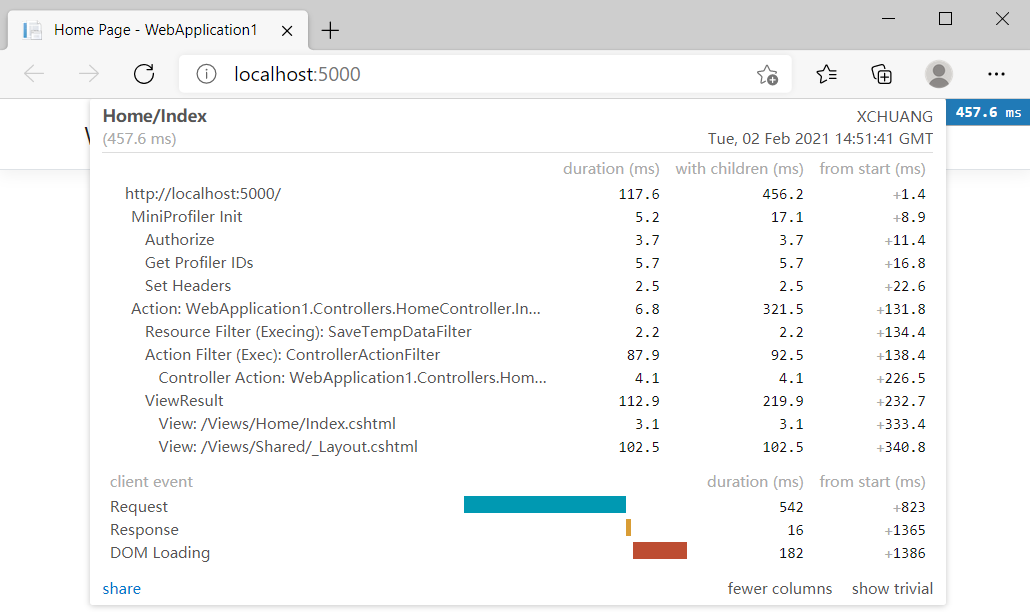
MiniProfiler 会提供 页面加载时间 和 数据库查询性能指标,接下来把程序跑起来,你会看到如下的性能指标图。
有些朋友可能就要问了,大体时间我是知道了,那如果我只想获取某一指定代码块的执行时间呢?当然也是可以的,下面的代码展示了如何去实现。
- public class HomeController : Controller
- {
- ILogger<HomeController> logger;
- public HomeController(ILogger<HomeController> logger)
- {
- this.logger = logger;
- }
- public IActionResult Index()
- {
- var miniProfiler = MiniProfiler.Current;
- List<Author> authors = new List<Author>();
- miniProfiler.RenderIncludes(this.HttpContext);
- using (miniProfiler.Step("Get Authors"))
- {
- authors.Add(new Author() { Id = 1, FirstName = "Joydip", LastName = "Kanjilal", Address = "Hyderabad, India" });
- authors.Add(new Author() { Id = 2, FirstName = "Stephen", LastName = "Smith", Address = "NY, USA" });
- authors.Add(new Author() { Id = 3, FirstName = "Anand", LastName = "Narayanan", Address = "Chennai, India" });
- authors.Add(new Author() { Id = 4, FirstName = "Steve", LastName = "Jones", Address = "London, UK" });
- }
- return View(authors);
- }
- }
- public class Author
- {
- public int Id { get; set; }
- public string FirstName { get; set; }
- public string LastName { get; set; }
- public string Address { get; set; }
- }
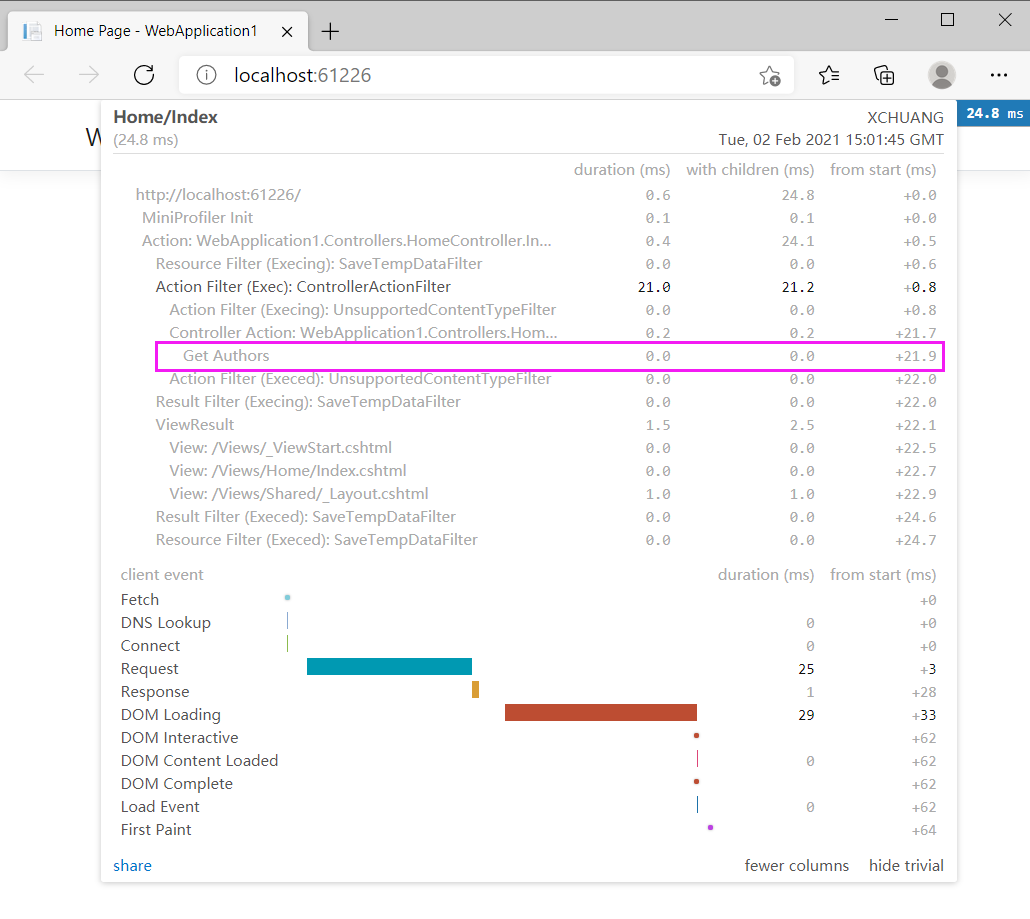
从上面的代码中可以看到,我用 using (miniProfiler.Step("Get Authors")) 做了语句块标记,理论上 mini-profile 窗口上应该有类似 Get Authors 指标栏,接下来把程序跑起来,一起来看看效果。
除了顺向操作,你也可以指定让某些代码块不要显示在 mini-profile 中,需要做的是调用 Ignore() 即可,如下代码所示:
- using (MiniProfiler.Current.Ignore())
- {
- // Write code here that you don't
- // want MiniProfiler to profile
- }
使用 MiniProfile 分析 ADO.NET 查询
除了做一些常规的页面分析,还可以直接对 ADO.NET 查询性能进行分析,这就????了,要这么做的话,需要使用 ProfileDbConnection 和 ProfileDbCommand 即可,如下代码所示:
- public IActionResult Index()
- {
- using (SqlConnection connection = new SqlConnection(@"Data Source=.; Initial Catalog=PYZ_L; Trusted_Connection=Yes"))
- {
- using (ProfiledDbConnection profiledDbConnection = new ProfiledDbConnection(connection, MiniProfiler.Current))
- {
- if (profiledDbConnection.State != System.Data.ConnectionState.Open)
- {
- profiledDbConnection.Open();
- }
- using (SqlCommand command = new SqlCommand("Select * From Clothes", connection))
- {
- using (ProfiledDbCommand profiledDbCommand = new ProfiledDbCommand(command, connection, MiniProfiler.Current))
- {
- var data = profiledDbCommand.ExecuteReader();
- //Write code here to populate the list of Authors
- }
- }
- }
- }
- return View();
- }
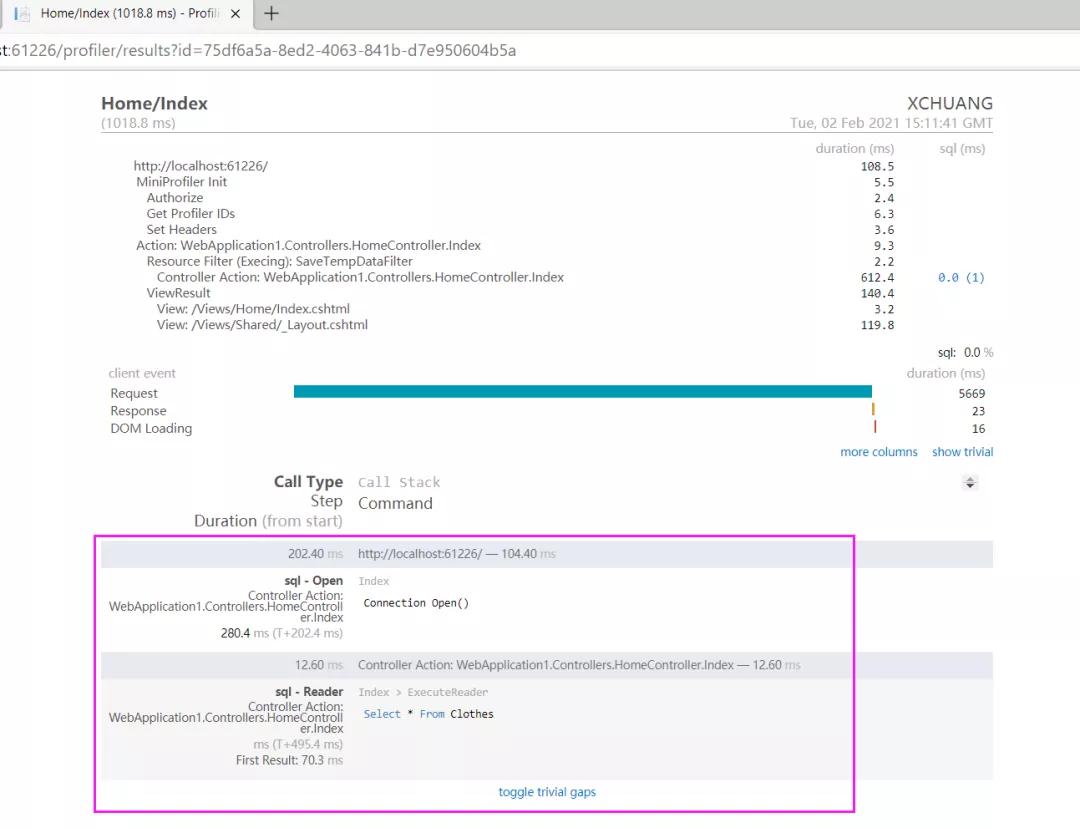
从上图可以看到,确实对 ADO.NET 查询有着清晰的分析,相信在帮助大家分析问题时很有帮助。
MiniProfiler 是一个可应用于 .NET, Ruby, Go 和 Node.js 的性能分析工具,你可以使用 MiniProfiler 去分析 Dapper,Linq2SQL,Entity Framework 所使用的sql的查询性能,此外 MimiProfile 之所以 Mini,意味着它介入到你的应用程序中所带来的性能开销微乎其微,所以大家可放心的丢到生产上去吧!
译文链接:https://www.infoworld.com/article/3330560/how-to-use-miniprofiler-in-aspnet-core.html
相关文章
- 【愚公系列】2023年01月 网安实验-.NET程序的破解与加密
- Visual Studio 统一代码格式插件 AStyleExtension
- 启明云端分享:ESP32C3简单IO及串口小贴士
- WPF资源字典怎么用
- 想查找Windows 10上安装的.NET版本,用这四种方法,简单快捷
- AWS 一周回顾 – 2022 年 10 月 17 日
- java jsonp
- 宣布推出适用于 .NET 的移植助手
- AWS 加入 .NET 基金会
- 全新推出 – 下一代 I/O 优化的 EC2 实例 (I3en)
- 使用 Amazon EBS 优化实例突发功能提高应用程序性能并降低成本
- WPF使用AvalonEdit实现代码高亮显示、搜索、替换功能
- 在 Asp.Net Core 中什么是认证和授权
- WPF中用户控件和自定义控件
- WPF常用UI库和图表库(MahApps、HandyControl、LiveCharts)
- WPF 日期选择器和时间选择器
- WPF-带填充的 WrapPanel
- .Net 7 团队把国内的龙芯确实当做一等公民和弃用的项目
- Android WebView不能加载ajax?加载ajax无效?
- asp.net之treeview无法显示树结点图标(IP与域名的表现竟不一样)