
Seaborn 常用的 10 种数据分析图表
2023-03-07 09:51:29 时间
内置示例数据集
seaborn内置了十几个示例数据集,通过load_dataset函数可以调用。
其中包括常见的泰坦尼克、鸢尾花等经典数据集。
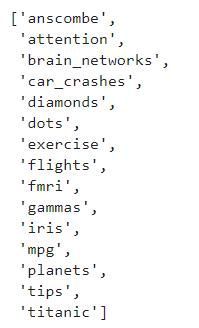
- # 查看数据集种类
- import seaborn as sns
- sns.get_dataset_names()
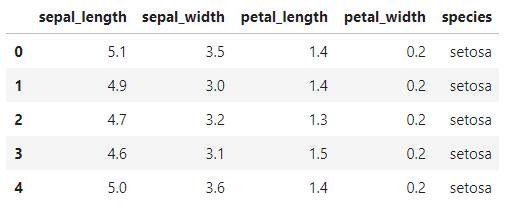
- import seaborn as sns
- # 导出鸢尾花数据集
- data = sns.load_dataset('iris')
- data.head()
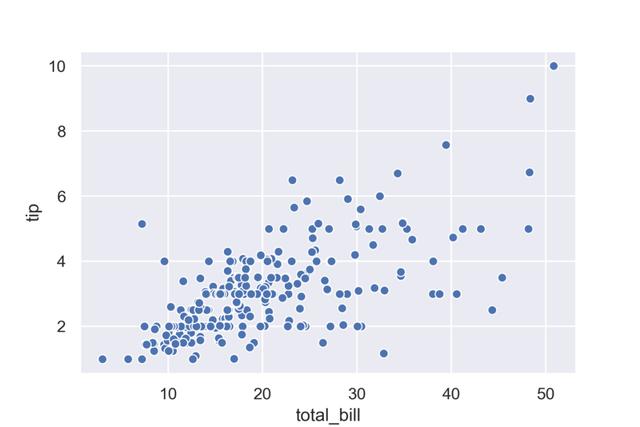
1. 散点图
函数sns.scatterplot
- import seaborn as sns
- sns.set()
- import matplotlib.pyplot as plt
- %matplotlib inline
- # 小费数据集
- tips = sns.load_dataset('tips')
- ax = sns.scatterplot(x='total_bill',y='tip',data=tips)
- plt.show()
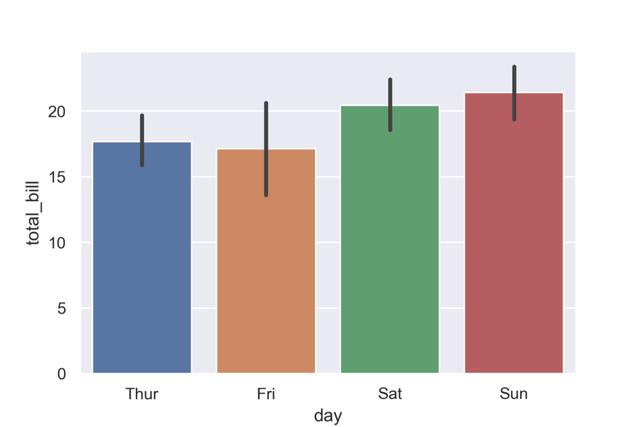
2. 条形图
函数sns.barplot
显示数据平均值和置信区间
- import seaborn as sns
- sns.set()
- import matplotlib.pyplot as plt
- %matplotlib inline
- # 小费数据集
- tips = sns.load_dataset("tips")
- ax = sns.barplot(x="day", y="total_bill", data=tips)
- plt.show()
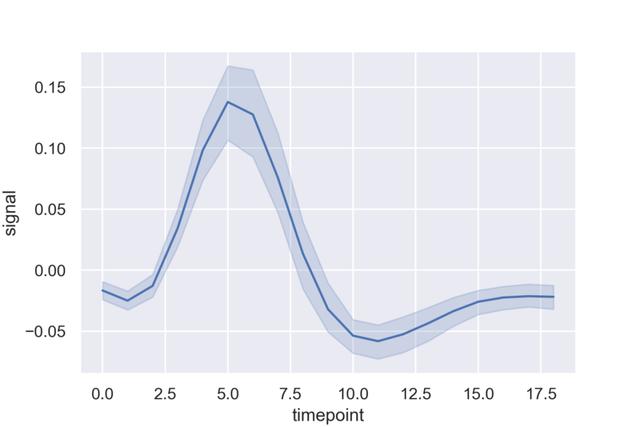
3. 线型图
函数sns.lineplot
绘制折线图和置信区间
- import seaborn as sns
- sns.set()
- import matplotlib.pyplot as plt
- %matplotlib inline
- fmri = sns.load_dataset("fmri")
- ax = sns.lineplot(x="timepoint", y="signal", data=fmri)
- plt.show()
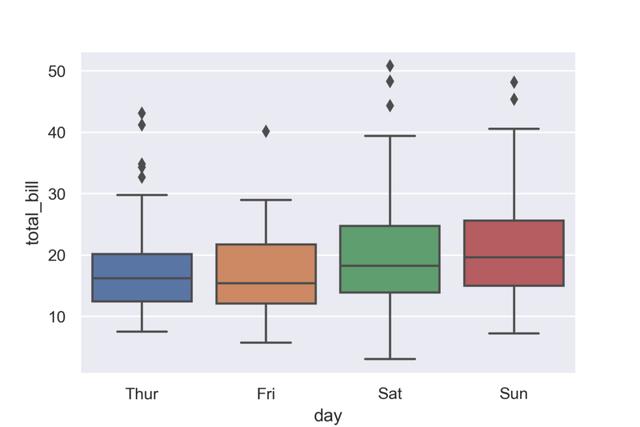
4. 箱线图
函数seaborn.boxplot
- import seaborn as sns
- sns.set()
- import matplotlib.pyplot as plt
- %matplotlib inline
- tips = sns.load_dataset("tips")
- ax = sns.boxplot(x="day", y="total_bill", data=tips)
- plt.show()
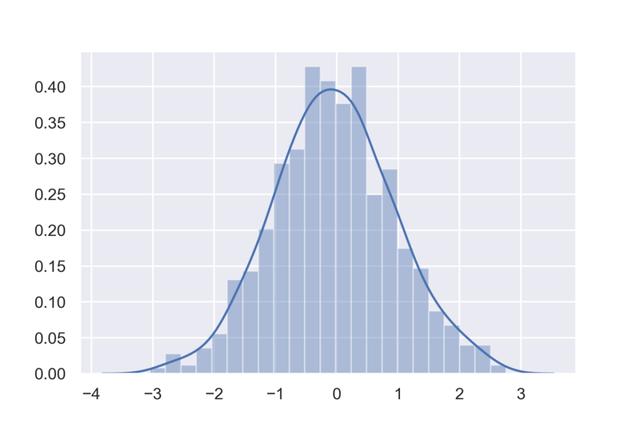
5. 直方图
函数seaborn.distplot
- import seaborn as sns
- import numpy as np
- sns.set()
- import matplotlib.pyplot as plt
- %matplotlib inline
- np.random.seed(0)
- x = np.random.randn(1000)
- ax = sns.distplot(x)
- plt.show()
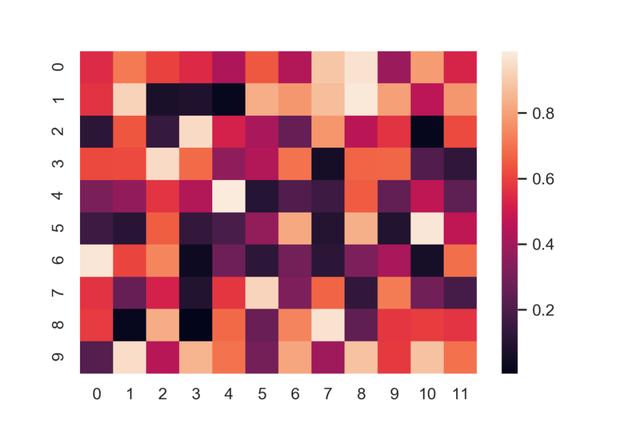
6. 热力图
函数seaborn.heatmap
- import numpy as np
- np.random.seed(0)
- import seaborn as sns
- sns.set()
- import matplotlib.pyplot as plt
- %matplotlib inline
- uniform_data = np.random.rand(10, 12)
- ax = sns.heatmap(uniform_data)
- plt.show()
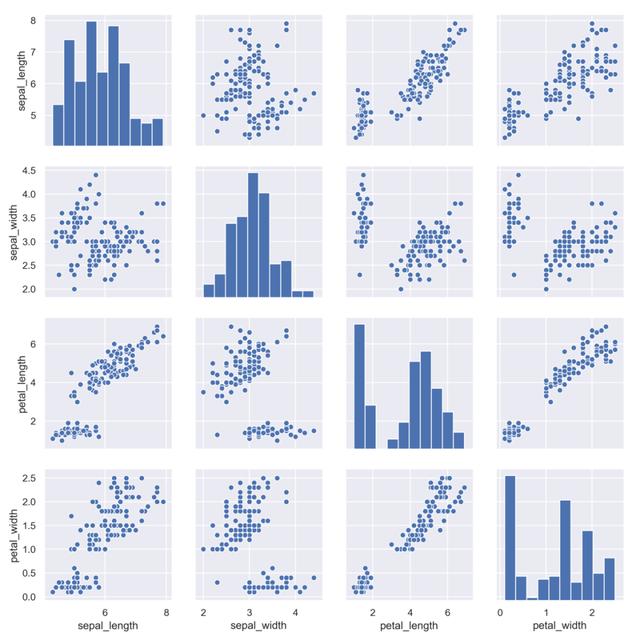
7. 散点图矩阵
函数sns.pairplot
- import seaborn as sns
- sns.set()
- import matplotlib.pyplot as plt
- %matplotlib inline
- iris = sns.load_dataset("iris")
- ax = sns.pairplot(iris)
- plt.show()
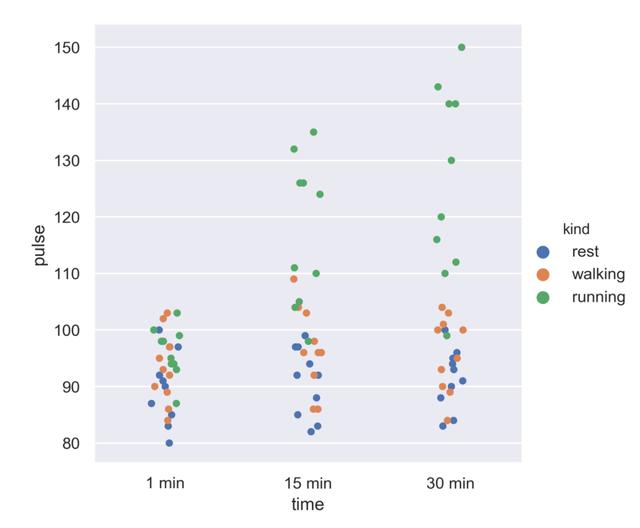
8. 分类散点图
函数seaborn.catplot
- import seaborn as sns
- sns.set()
- import matplotlib.pyplot as plt
- %matplotlib inline
- exercise = sns.load_dataset("exercise")
- ax = sns.catplot(x="time", y="pulse", hue="kind", data=exercise)\
- plt.show()
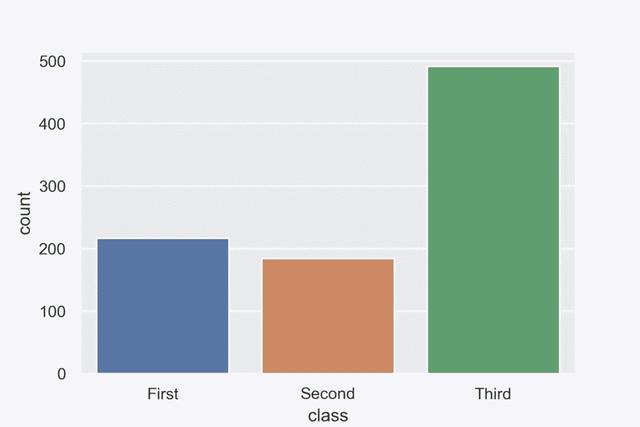
9. 计数条形图
函数seaborn.countplot
- import seaborn as sns
- sns.set()
- import matplotlib.pyplot as plt
- %matplotlib inline
- titanic = sns.load_dataset("titanic")
- ax = sns.countplot(x="class", data=titanic)
- plt.show()
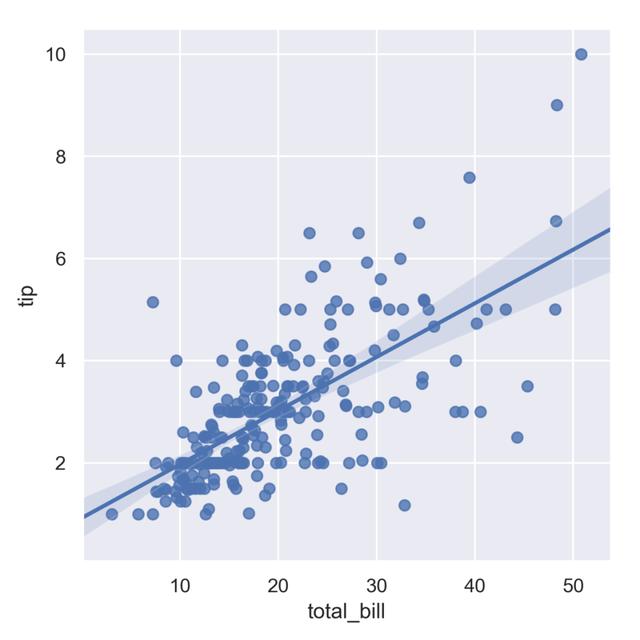
10. 回归图
函数 seaborn.lmplot
绘制散点及回归图
- import seaborn as sns
- sns.set()
- import matplotlib.pyplot as plt
- %matplotlib inline
- tips = sns.load_dataset("tips")
- ax = sns.lmplot(x="total_bill", y="tip", data=tips)
- plt.show()
相关文章
- 数据孤岛是业务效率的无声杀手
- 2023展望:新的一年将给大数据分析领域带来什么?
- 阿里云ADB基于Hudi构建Lakehouse的实践
- 大数据在医疗保健领域的使用案例
- 微软增加说明:KB5021751 更新扫描已经 / 即将过时 Office 过程中不会触碰用户隐私
- 2022 Gartner全球云数据库管理系统魔力象限发布 腾讯云数据库入选
- 场景化、重实操,分享一个实时数仓实践案例
- Arctic的湖仓一体践行之路
- 分布式计算MapReduce究竟是怎么一回事?
- 淘系数据模型治理优秀实践
- 大数据分析对医疗保健的影响
- 当我们说大数据Hadoop,究竟在说什么?
- 2022年及以后大数据的五个发展趋势
- 网易严选离线数仓治理实践
- 2023 年数据治理趋势
- 一份“靠谱”的年度经营计划,你学会了吗?
- 漫谈对大数据的思考
- 测试一下,读懂数据的能力,你有吗?
- 用艺术的眼光探索数据之美
- 聊聊数据分析成果如何落地